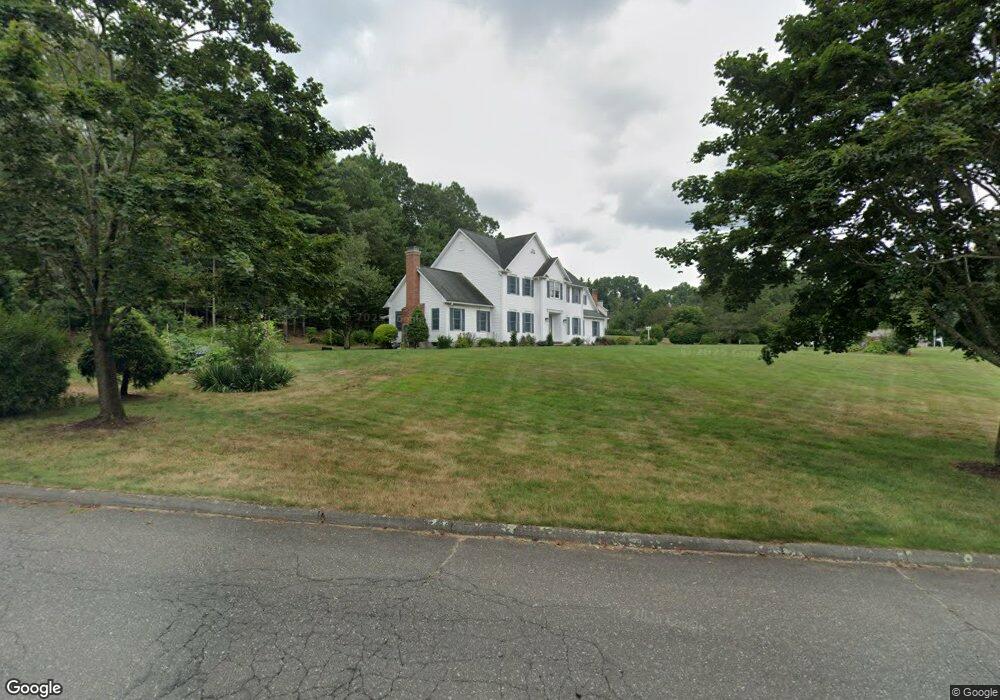
9 Red Gap Rd Wilbraham, MA 01095
Estimated Value: $641,763 - $853,000
4
Beds
3
Baths
2,842
Sq Ft
$258/Sq Ft
Est. Value
About This Home
This home is located at 9 Red Gap Rd, Wilbraham, MA 01095 and is currently estimated at $734,588, approximately $258 per square foot. 9 Red Gap Rd is a home located in Hampden County with nearby schools including Minnechaug Regional High School and Wilbraham & Monson Academy.
Ownership History
Date
Name
Owned For
Owner Type
Purchase Details
Closed on
Jun 27, 1995
Sold by
Dan Roulier & Assoc
Bought by
Paolucci Salvatore and Paolucci Maria
Current Estimated Value
Home Financials for this Owner
Home Financials are based on the most recent Mortgage that was taken out on this home.
Original Mortgage
$150,000
Interest Rate
7.82%
Mortgage Type
Purchase Money Mortgage
Purchase Details
Closed on
Sep 22, 1994
Sold by
Wilbraview Lp
Bought by
Dan Roulier Assocs
Home Financials for this Owner
Home Financials are based on the most recent Mortgage that was taken out on this home.
Original Mortgage
$175,000
Interest Rate
8.56%
Mortgage Type
Purchase Money Mortgage
Create a Home Valuation Report for This Property
The Home Valuation Report is an in-depth analysis detailing your home's value as well as a comparison with similar homes in the area
Home Values in the Area
Average Home Value in this Area
Purchase History
| Date | Buyer | Sale Price | Title Company |
|---|---|---|---|
| Paolucci Salvatore | $285,725 | -- | |
| Dan Roulier Assocs | $60,000 | -- |
Source: Public Records
Mortgage History
| Date | Status | Borrower | Loan Amount |
|---|---|---|---|
| Open | Dan Roulier Assocs | $30,000 | |
| Open | Dan Roulier Assocs | $141,800 | |
| Closed | Dan Roulier Assocs | $150,000 | |
| Previous Owner | Dan Roulier Assocs | $175,000 | |
| Closed | Dan Roulier Assocs | $60,000 |
Source: Public Records
Tax History
| Year | Tax Paid | Tax Assessment Tax Assessment Total Assessment is a certain percentage of the fair market value that is determined by local assessors to be the total taxable value of land and additions on the property. | Land | Improvement |
|---|---|---|---|---|
| 2025 | $10,615 | $593,700 | $132,000 | $461,700 |
| 2024 | $10,569 | $571,300 | $132,000 | $439,300 |
| 2023 | $9,647 | $510,300 | $132,000 | $378,300 |
| 2022 | $9,647 | $470,800 | $132,000 | $338,800 |
| 2021 | $9,356 | $407,500 | $130,500 | $277,000 |
| 2020 | $9,120 | $407,500 | $130,500 | $277,000 |
| 2019 | $8,415 | $386,000 | $130,500 | $255,500 |
| 2018 | $8,397 | $370,900 | $130,500 | $240,400 |
| 2017 | $8,160 | $370,900 | $130,500 | $240,400 |
| 2016 | $8,126 | $376,200 | $144,500 | $231,700 |
| 2015 | $7,855 | $376,200 | $144,500 | $231,700 |
Source: Public Records
Map
Nearby Homes
Your Personal Tour Guide
Ask me questions while you tour the home.