Estimated Value: $305,789 - $359,000
3
Beds
2
Baths
2,473
Sq Ft
$134/Sq Ft
Est. Value
About This Home
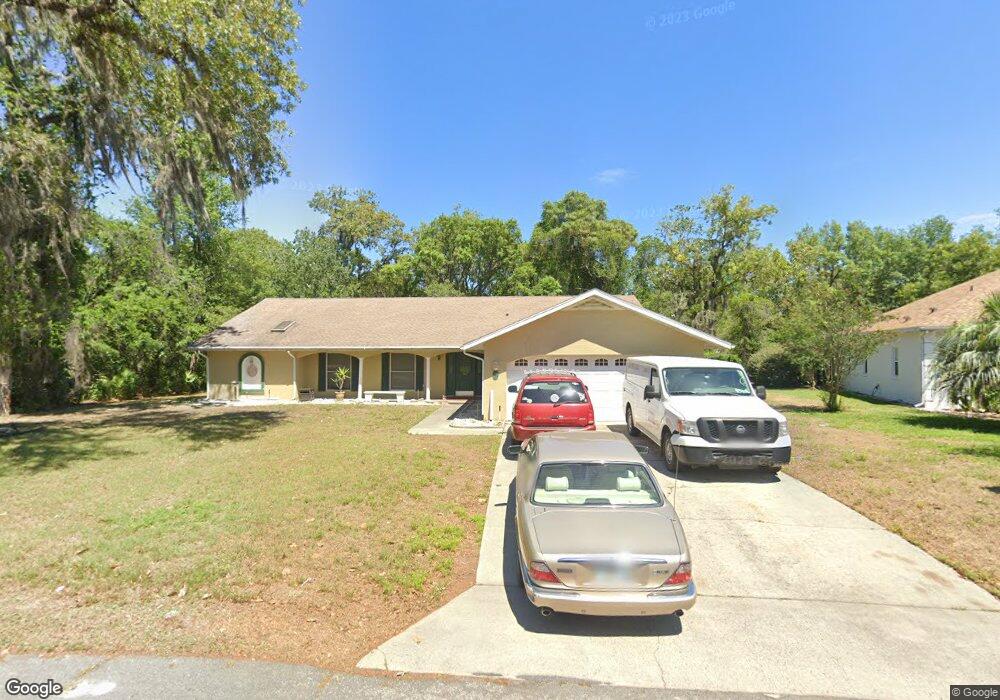
This home is located at 9 Redbay Ct E, Homosassa, FL 34446 and is currently estimated at $331,447, approximately $134 per square foot. 9 Redbay Ct E is a home located in Citrus County with nearby schools including Lecanto Primary School, Lecanto Middle School, and Lecanto High School.
Ownership History
Date
Name
Owned For
Owner Type
Purchase Details
Closed on
Mar 11, 2016
Sold by
Dunn William M
Bought by
Clarke Charles E
Current Estimated Value
Home Financials for this Owner
Home Financials are based on the most recent Mortgage that was taken out on this home.
Original Mortgage
$128,534
Outstanding Balance
$101,653
Interest Rate
3.79%
Mortgage Type
New Conventional
Estimated Equity
$229,794
Purchase Details
Closed on
Nov 19, 2004
Sold by
Coudriet Gregory B and Etheridge Kathryn M
Bought by
Dunn William M
Home Financials for this Owner
Home Financials are based on the most recent Mortgage that was taken out on this home.
Original Mortgage
$100,000
Interest Rate
5%
Mortgage Type
Purchase Money Mortgage
Purchase Details
Closed on
Mar 1, 1998
Bought by
Clarke Charles E
Purchase Details
Closed on
Oct 1, 1992
Bought by
Clarke Charles E
Purchase Details
Closed on
Nov 1, 1986
Bought by
Clarke Charles E
Create a Home Valuation Report for This Property
The Home Valuation Report is an in-depth analysis detailing your home's value as well as a comparison with similar homes in the area
Home Values in the Area
Average Home Value in this Area
Purchase History
| Date | Buyer | Sale Price | Title Company |
|---|---|---|---|
| Clarke Charles E | $120,000 | Land Title Citrus County Inc | |
| Dunn William M | $175,000 | Southern Sun Title Company | |
| Clarke Charles E | $109,900 | -- | |
| Clarke Charles E | $100 | -- | |
| Clarke Charles E | $13,500 | -- |
Source: Public Records
Mortgage History
| Date | Status | Borrower | Loan Amount |
|---|---|---|---|
| Open | Clarke Charles E | $128,534 | |
| Previous Owner | Dunn William M | $100,000 |
Source: Public Records
Tax History
| Year | Tax Paid | Tax Assessment Tax Assessment Total Assessment is a certain percentage of the fair market value that is determined by local assessors to be the total taxable value of land and additions on the property. | Land | Improvement |
|---|---|---|---|---|
| 2025 | $1,589 | $135,659 | -- | -- |
| 2024 | $1,545 | $131,836 | -- | -- |
| 2023 | $1,545 | $127,996 | $0 | $0 |
| 2022 | $1,441 | $124,268 | $0 | $0 |
| 2021 | $1,385 | $120,649 | $0 | $0 |
| 2020 | $1,280 | $164,701 | $7,000 | $157,701 |
| 2019 | $1,267 | $137,773 | $8,850 | $128,923 |
| 2018 | $1,237 | $126,031 | $7,330 | $118,701 |
| 2017 | $1,231 | $111,791 | $9,000 | $102,791 |
| 2016 | $1,067 | $98,664 | $9,000 | $89,664 |
| 2015 | $1,081 | $97,978 | $12,100 | $85,878 |
| 2014 | $1,101 | $97,200 | $8,070 | $89,130 |
Source: Public Records
Map
Nearby Homes
Your Personal Tour Guide
Ask me questions while you tour the home.