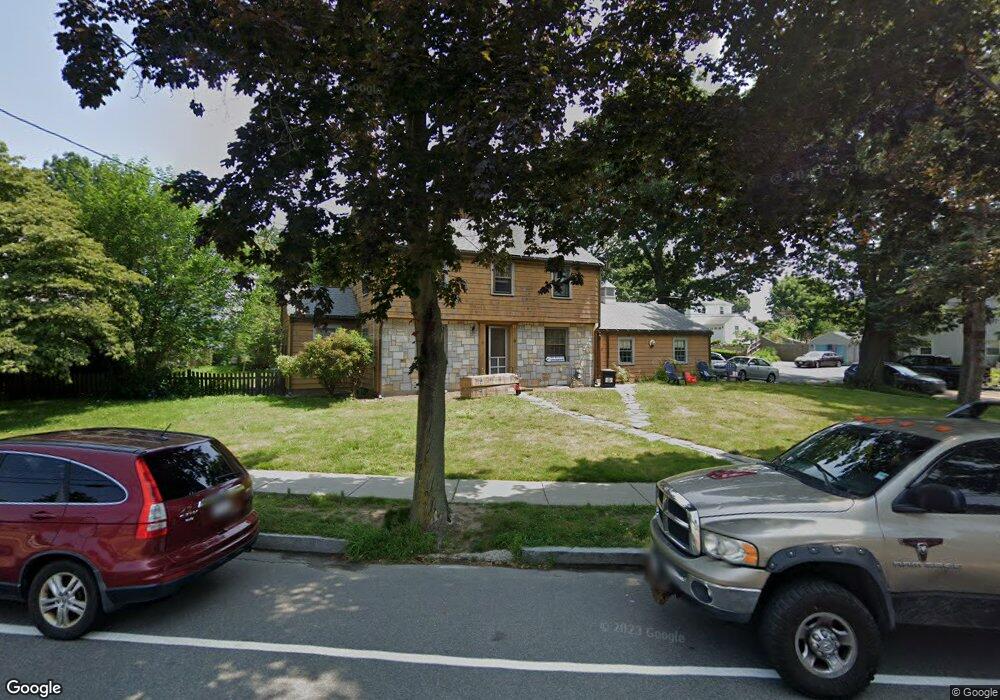
9 Rice Rd Quincy, MA 02170
Wollaston NeighborhoodEstimated Value: $759,000 - $819,000
3
Beds
2
Baths
1,686
Sq Ft
$473/Sq Ft
Est. Value
About This Home
This home is located at 9 Rice Rd, Quincy, MA 02170 and is currently estimated at $796,649, approximately $472 per square foot. 9 Rice Rd is a home located in Norfolk County with nearby schools including Beechwood Knoll Elementary School, Central Middle School, and North Quincy High School.
Ownership History
Date
Name
Owned For
Owner Type
Purchase Details
Closed on
May 25, 2023
Sold by
Miceli Ft and Miceli
Bought by
Stanford John and Stanford Cecelia
Current Estimated Value
Home Financials for this Owner
Home Financials are based on the most recent Mortgage that was taken out on this home.
Original Mortgage
$726,000
Outstanding Balance
$702,973
Interest Rate
6.27%
Mortgage Type
Purchase Money Mortgage
Estimated Equity
$93,676
Purchase Details
Closed on
Jul 11, 2012
Sold by
Miceli Leonard F and Miceli Patricia J
Bought by
Miceli Ft and Miceli
Create a Home Valuation Report for This Property
The Home Valuation Report is an in-depth analysis detailing your home's value as well as a comparison with similar homes in the area
Home Values in the Area
Average Home Value in this Area
Purchase History
| Date | Buyer | Sale Price | Title Company |
|---|---|---|---|
| Stanford John | $775,000 | None Available | |
| Miceli Ft | -- | -- | |
| Miceli Ft | -- | -- |
Source: Public Records
Mortgage History
| Date | Status | Borrower | Loan Amount |
|---|---|---|---|
| Open | Stanford John | $726,000 | |
| Previous Owner | Miceli Ft | $50,000 |
Source: Public Records
Tax History
| Year | Tax Paid | Tax Assessment Tax Assessment Total Assessment is a certain percentage of the fair market value that is determined by local assessors to be the total taxable value of land and additions on the property. | Land | Improvement |
|---|---|---|---|---|
| 2025 | $8,476 | $735,100 | $386,300 | $348,800 |
| 2024 | $7,983 | $708,300 | $386,300 | $322,000 |
| 2023 | $7,430 | $667,600 | $368,100 | $299,500 |
| 2022 | $6,920 | $577,600 | $295,100 | $282,500 |
| 2021 | $6,812 | $561,100 | $295,100 | $266,000 |
| 2020 | $6,875 | $553,100 | $295,100 | $258,000 |
| 2019 | $6,542 | $521,300 | $276,000 | $245,300 |
| 2018 | $6,383 | $478,500 | $251,200 | $227,300 |
| 2017 | $6,613 | $466,700 | $251,200 | $215,500 |
| 2016 | $6,168 | $429,500 | $228,600 | $200,900 |
| 2015 | $5,728 | $392,300 | $208,100 | $184,200 |
| 2014 | $5,460 | $367,400 | $198,300 | $169,100 |
Source: Public Records
Map
Nearby Homes
- 9 Chick St
- 10 W Elm Ave
- 11 Gould St
- 19 Bass St
- 163 Clay St Unit 3
- 20 Ellington Rd
- 915 Hancock St Unit 2
- 28 Apthorp St
- 40 Virginia Rd
- 100 Grand View Ave Unit 9C
- 10 Weston Ave Unit 322
- 45 Oval Rd Unit 34
- 27 Herbert Rd
- 999 Hancock St Unit 402
- 72 Oakland Ave
- 267-269 Farrington St
- 1025 Hancock St Unit 6J
- 105 Sea St Unit 105
- 105 Sea St Unit 102
- 245 Sea St Unit 45
Your Personal Tour Guide
Ask me questions while you tour the home.