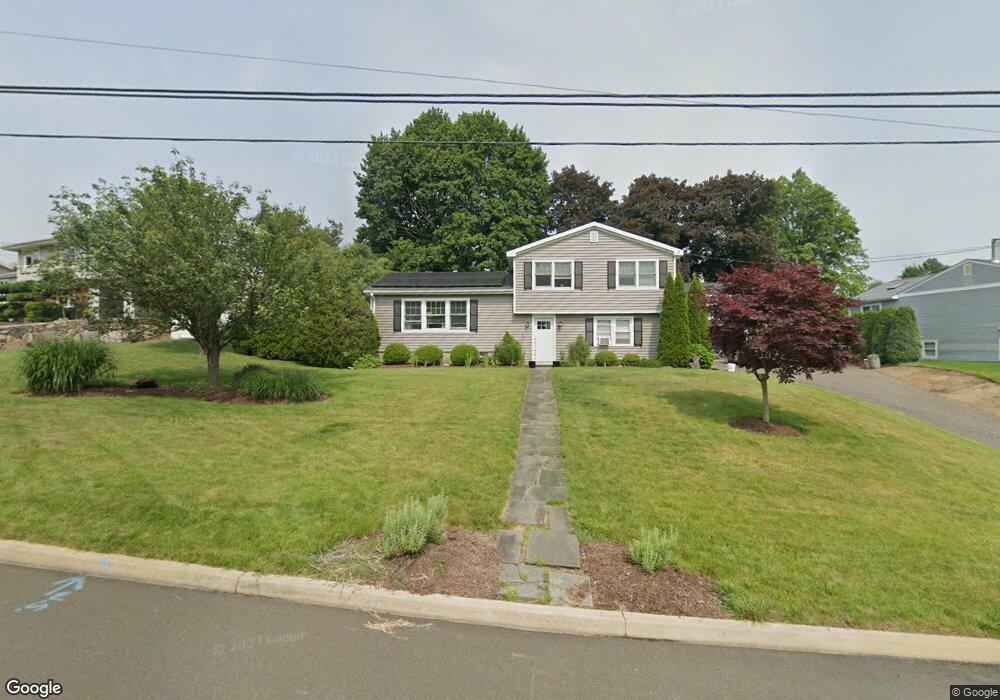
9 Richlee Rd Norwalk, CT 06851
East Norwalk NeighborhoodEstimated Value: $720,000 - $755,000
3
Beds
2
Baths
1,708
Sq Ft
$433/Sq Ft
Est. Value
About This Home
This home is located at 9 Richlee Rd, Norwalk, CT 06851 and is currently estimated at $739,176, approximately $432 per square foot. 9 Richlee Rd is a home located in Fairfield County with nearby schools including Naramake Elementary School, Nathan Hale Middle School, and Norwalk High School.
Ownership History
Date
Name
Owned For
Owner Type
Purchase Details
Closed on
Oct 7, 2020
Sold by
Bisceglie Rosemarie
Bought by
Bisceglie Rosemarie and Hoffmann Douglas
Current Estimated Value
Home Financials for this Owner
Home Financials are based on the most recent Mortgage that was taken out on this home.
Original Mortgage
$218,750
Outstanding Balance
$154,634
Interest Rate
2.8%
Mortgage Type
Balloon
Estimated Equity
$584,542
Purchase Details
Closed on
Sep 30, 2010
Sold by
Us Bk
Bought by
Bisceglie Rosemarie
Home Financials for this Owner
Home Financials are based on the most recent Mortgage that was taken out on this home.
Original Mortgage
$240,000
Interest Rate
4.44%
Purchase Details
Closed on
May 27, 2010
Sold by
Torcasio Antonia
Bought by
Us Bk
Purchase Details
Closed on
Feb 2, 2004
Sold by
Verrastro Frank T and Verrastro Anna Maria
Bought by
Torcasio Vincenzo
Create a Home Valuation Report for This Property
The Home Valuation Report is an in-depth analysis detailing your home's value as well as a comparison with similar homes in the area
Home Values in the Area
Average Home Value in this Area
Purchase History
| Date | Buyer | Sale Price | Title Company |
|---|---|---|---|
| Bisceglie Rosemarie | -- | None Available | |
| Bisceglie Rosemarie | -- | None Available | |
| Bisceglie Rosemarie | $313,000 | -- | |
| Bisceglie Rosemarie | $313,000 | -- | |
| Us Bk | -- | -- | |
| Us Bk | -- | -- | |
| Torcasio Vincenzo | $421,000 | -- | |
| Torcasio Vincenzo | $421,000 | -- |
Source: Public Records
Mortgage History
| Date | Status | Borrower | Loan Amount |
|---|---|---|---|
| Open | Bisceglie Rosemarie | $218,750 | |
| Closed | Bisceglie Rosemarie | $218,750 | |
| Previous Owner | Torcasio Vincenzo | $240,000 |
Source: Public Records
Tax History
| Year | Tax Paid | Tax Assessment Tax Assessment Total Assessment is a certain percentage of the fair market value that is determined by local assessors to be the total taxable value of land and additions on the property. | Land | Improvement |
|---|---|---|---|---|
| 2025 | $9,978 | $416,680 | $176,400 | $240,280 |
| 2024 | $9,830 | $416,680 | $176,400 | $240,280 |
| 2023 | $7,471 | $296,930 | $132,300 | $164,630 |
| 2022 | $6,567 | $265,940 | $132,300 | $133,640 |
| 2021 | $6,396 | $265,940 | $132,300 | $133,640 |
| 2020 | $6,392 | $265,940 | $132,300 | $133,640 |
| 2019 | $6,213 | $265,940 | $132,300 | $133,640 |
| 2018 | $6,908 | $259,080 | $144,970 | $114,110 |
| 2017 | $6,671 | $259,090 | $144,970 | $114,120 |
| 2016 | $6,607 | $259,080 | $144,970 | $114,110 |
| 2015 | $6,588 | $259,080 | $144,970 | $114,110 |
| 2014 | $6,503 | $259,080 | $144,970 | $114,110 |
Source: Public Records
Map
Nearby Homes
- 80 County St Unit 9K
- 80 County St Unit 11K
- 15 Dairy Farm Rd
- 60 Wolfpit Ave Unit 4B
- 23 Macintosh Rd
- 12 Willard Rd Unit 8
- 26 Treadwell Ave
- 50 Kings Hwy S
- 71 Saddle Rd
- 31 Franklin St
- 16 Sunset Hill Ave
- 11 Margaret St
- 142 Wolfpit Ave
- 13 Orchard Hill Rd
- 75 Newtown Ave
- 142 East Ave Unit 301
- 144 East Ave Unit B404
- 11 Manitou Ct
- 189 East Ave
- 18 Cloverly Cir
Your Personal Tour Guide
Ask me questions while you tour the home.