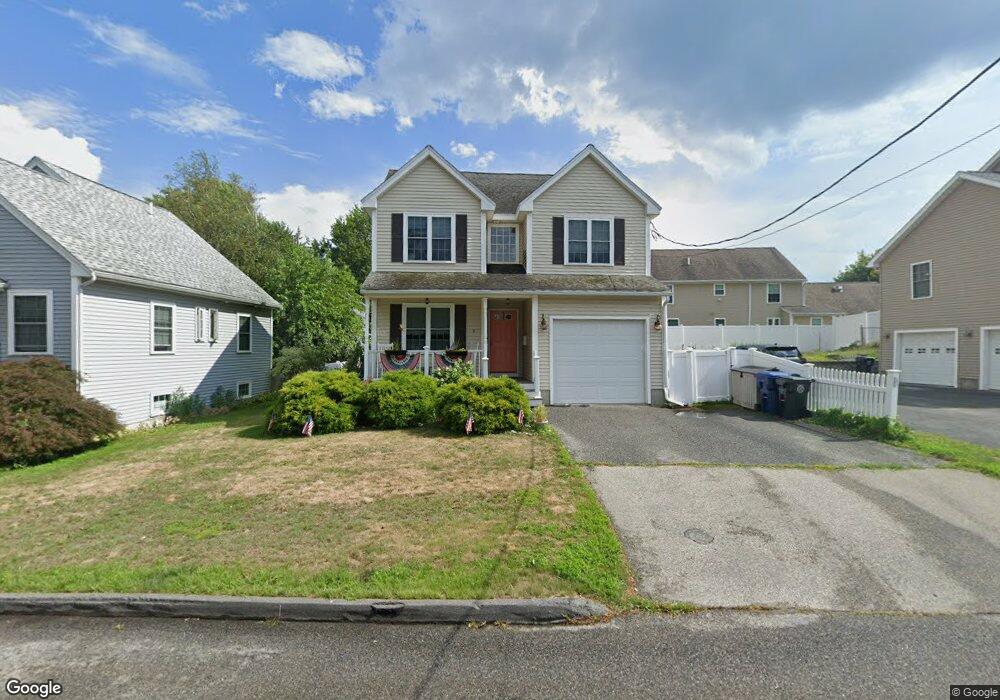
9 Riverside St Danvers, MA 01923
Estimated Value: $706,000 - $1,008,000
3
Beds
1
Bath
1,006
Sq Ft
$782/Sq Ft
Est. Value
About This Home
This home is located at 9 Riverside St, Danvers, MA 01923 and is currently estimated at $786,865, approximately $782 per square foot. 9 Riverside St is a home located in Essex County with nearby schools including Danvers High School, St John The Baptist School, and Bishop Fenwick High School.
Ownership History
Date
Name
Owned For
Owner Type
Purchase Details
Closed on
Sep 25, 1996
Sold by
Francis Arthur J and Francis Franciss Nancy
Bought by
Lantych John E and Lantych Cathione M
Current Estimated Value
Purchase Details
Closed on
Sep 16, 1988
Sold by
Taylor Thomas N
Bought by
Francis Arthur J
Purchase Details
Closed on
Apr 7, 1987
Sold by
Marvel George
Bought by
Taylor Thomas N
Create a Home Valuation Report for This Property
The Home Valuation Report is an in-depth analysis detailing your home's value as well as a comparison with similar homes in the area
Home Values in the Area
Average Home Value in this Area
Purchase History
| Date | Buyer | Sale Price | Title Company |
|---|---|---|---|
| Lantych John E | $160,000 | -- | |
| Francis Arthur J | $145,500 | -- | |
| Taylor Thomas N | $145,300 | -- |
Source: Public Records
Mortgage History
| Date | Status | Borrower | Loan Amount |
|---|---|---|---|
| Open | Taylor Thomas N | $154,000 | |
| Closed | Taylor Thomas N | $150,000 |
Source: Public Records
Tax History
| Year | Tax Paid | Tax Assessment Tax Assessment Total Assessment is a certain percentage of the fair market value that is determined by local assessors to be the total taxable value of land and additions on the property. | Land | Improvement |
|---|---|---|---|---|
| 2025 | $7,061 | $642,500 | $321,100 | $321,400 |
| 2024 | $6,898 | $620,900 | $310,000 | $310,900 |
| 2023 | $6,699 | $570,100 | $280,100 | $290,000 |
| 2022 | $6,628 | $523,500 | $254,600 | $268,900 |
| 2021 | $6,379 | $477,800 | $242,400 | $235,400 |
| 2020 | $6,240 | $477,800 | $242,400 | $235,400 |
| 2019 | $5,826 | $438,700 | $210,300 | $228,400 |
| 2018 | $5,729 | $423,100 | $210,300 | $212,800 |
| 2017 | $5,533 | $389,900 | $191,500 | $198,400 |
| 2016 | $5,335 | $375,700 | $182,700 | $193,000 |
| 2015 | $5,110 | $342,700 | $160,500 | $182,200 |
Source: Public Records
Map
Nearby Homes
- 6 Mcdewell Ave Unit 4
- 76 Water St
- 59 Riverview Ave
- 147 High St
- 508 Elliott St
- 108 Abington Rd Unit 108
- 152 Endicott St
- 34 Bayview Terrace Unit 5
- 13 Giles Ave Unit 2
- 35 Bayview Terrace Unit 7
- 11 Riverside Ave Unit 111
- 7 Riverbank Ave Unit 7
- 7 Riverbank Ave
- 123 Livingstone Ave
- 0 Buttonwood Ln Unit 2
- 41 Northend St
- 9 Highland St
- 30 Driscoll St
- 35 High St Unit 3D
- 16 Tremont St
Your Personal Tour Guide
Ask me questions while you tour the home.