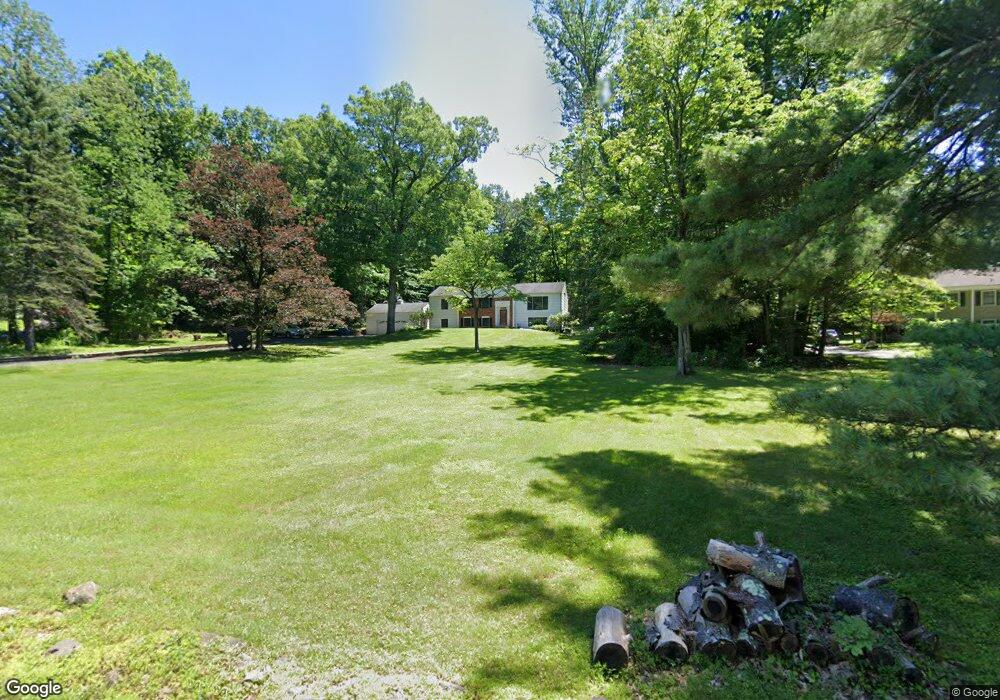
9 Roberts Rd Warren, NJ 07059
Estimated Value: $947,000 - $1,094,000
Studio
--
Bath
3,148
Sq Ft
$324/Sq Ft
Est. Value
About This Home
This home is located at 9 Roberts Rd, Warren, NJ 07059 and is currently estimated at $1,018,826, approximately $323 per square foot. 9 Roberts Rd is a home located in Somerset County with nearby schools including Woodland School, Warren Middle School, and Watchung Hills Regional High School.
Ownership History
Date
Name
Owned For
Owner Type
Purchase Details
Closed on
Jun 27, 2006
Sold by
Braunstein David E
Bought by
Garcia Jimmy and Avila Alina
Current Estimated Value
Home Financials for this Owner
Home Financials are based on the most recent Mortgage that was taken out on this home.
Original Mortgage
$552,000
Outstanding Balance
$326,441
Interest Rate
6.58%
Mortgage Type
New Conventional
Estimated Equity
$692,385
Purchase Details
Closed on
Apr 29, 2005
Sold by
Chen Kin Yam
Bought by
Yu Qian Lou and Liu Qing Wei
Home Financials for this Owner
Home Financials are based on the most recent Mortgage that was taken out on this home.
Original Mortgage
$359,650
Interest Rate
6.05%
Purchase Details
Closed on
Jun 29, 1992
Sold by
Greene Martin H and Greene Abby B
Bought by
Braunstein David E and Braunstein Nancy J
Create a Home Valuation Report for This Property
The Home Valuation Report is an in-depth analysis detailing your home's value as well as a comparison with similar homes in the area
Home Values in the Area
Average Home Value in this Area
Purchase History
| Date | Buyer | Sale Price | Title Company |
|---|---|---|---|
| Garcia Jimmy | $690,000 | -- | |
| Garcia Jimmy | $690,000 | None Available | |
| Yu Qian Lou | $656,000 | -- | |
| Braunstein David E | $283,000 | -- |
Source: Public Records
Mortgage History
| Date | Status | Borrower | Loan Amount |
|---|---|---|---|
| Open | Garcia Jimmy | $552,000 | |
| Closed | Garcia Jimmy | $552,000 | |
| Previous Owner | Yu Qian Lou | $359,650 |
Source: Public Records
Tax History
| Year | Tax Paid | Tax Assessment Tax Assessment Total Assessment is a certain percentage of the fair market value that is determined by local assessors to be the total taxable value of land and additions on the property. | Land | Improvement |
|---|---|---|---|---|
| 2025 | $12,625 | $750,900 | $385,100 | $365,800 |
| 2024 | $12,625 | $686,900 | $353,000 | $333,900 |
Source: Public Records
Map
Nearby Homes
- 3 Upper Warren Way
- 52 Valleyview Rd
- 50 Mountain Ave
- 3 Carol Terrace
- 22 Livingston Ave
- 137 High Oaks Dr
- 19 Glenview Dr
- 102 Iris Ct
- 220 Stirling Rd
- 204 Honeysuckle Ln
- 165 Jasmine Unit 613
- 127 Myrtle Rd
- 221 Myrtle Rd
- 155 Dogwood Ln
- 91 Hillcrest Rd
- 79 Park Place
- 8 Metzler St
- 122 Old Stirling Rd
- 29 Evergreen Ln
- 26 Sunrise Dr
Your Personal Tour Guide
Ask me questions while you tour the home.