
Seller's Agent in 2025
Christopher Buono
All Things Real Estate, Inc.
(781) 820-9722
70 Total Sales


Estimated Value: $484,000 - $495,000
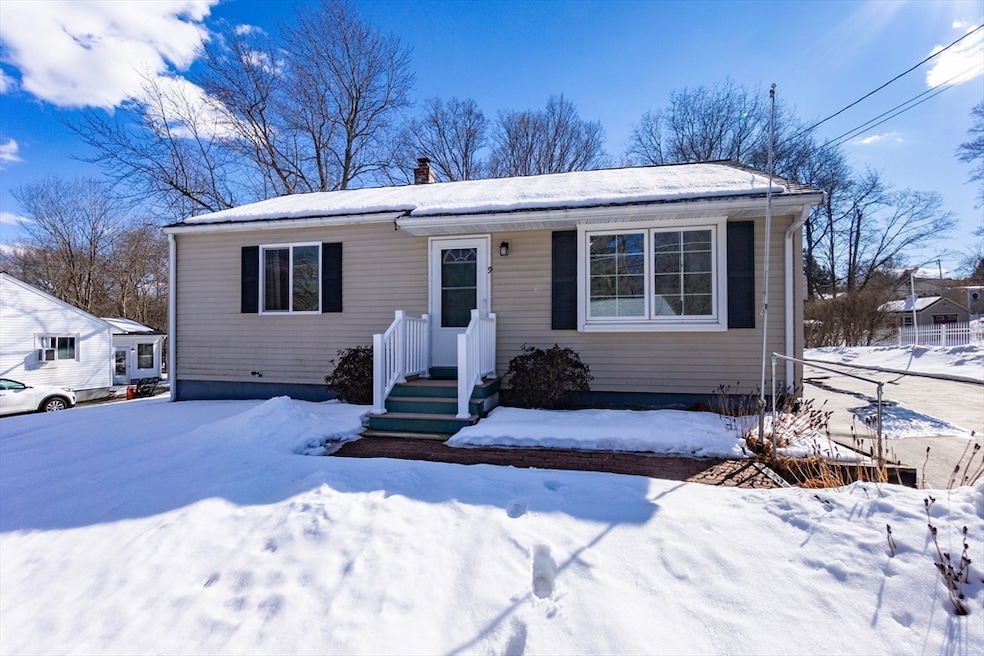
Don't miss this adorable 2 Bed / 1 Bath ranch in Westborough! Conveniently located off rt 9 & 135 making it an easy commute regardless of the destination. This loving home features hardwood floors, updated appliances & tile flooring in the kitchen, central AC, unfinished basement with laundry and tons of potential to add additional living space. Numerous recent updates including HVAC, roof and siding. The exterior features a spacious detached garage & shed, as well as a gorgeous back deck for entertaining or relaxing. Sitting on a picturesque .32 acres of land and a spacious & level rear yard, this home is move in ready but also offers great potential for its next owner. Seller welcomes offers with requests for buyer concession.
Last Agent to Sell the Property
All Things Real Estate, Inc. Listed on: 02/27/2025
We collect this data history from publicly available records. To have your information removed, we recommend requesting removal directly through your county’s website.
We collect this data history from publicly available records. To have your information removed, we recommend requesting removal directly through your county’s website.
| Date | Buyer | Sale Price | Title Company |
|---|---|---|---|
| $485,000 | None Available | ||
| $485,000 | None Available | ||
| -- | -- | ||
| -- | -- | ||
| $184,000 | -- | ||
| $184,000 | -- | ||
| $184,000 | -- |
We collect this data history from publicly available records. To have your information removed, we recommend requesting removal directly through your county’s website.
| Date | Status | Borrower | Loan Amount |
|---|---|---|---|
| Open | $250,000 | ||
| Closed | $250,000 | ||
| Previous Owner | $190,072 | ||
| Previous Owner | $6,537 | ||
| Previous Owner | $43,000 |
We collect this data history from publicly available records. To have your information removed, we recommend requesting removal directly through your county’s website.
| Date | Event | Price | List to Sale | Price per Sq Ft | Prior Sale |
|---|---|---|---|---|---|
| 03/20/2025 03/20/25 | Sold | $485,000 | +12.8% | $679 / Sq Ft | |
| 03/04/2025 03/04/25 | Pending | -- | -- | -- | |
| 02/27/2025 02/27/25 | For Sale | $429,900 | +133.6% | $602 / Sq Ft | |
| 04/24/2012 04/24/12 | Sold | $184,000 | -8.0% | $258 / Sq Ft | View Prior Sale |
| 04/02/2012 04/02/12 | Pending | -- | -- | -- | |
| 01/17/2012 01/17/12 | Price Changed | $199,999 | -4.7% | $280 / Sq Ft | |
| 11/20/2011 11/20/11 | For Sale | $209,900 | -- | $294 / Sq Ft |
We collect this data history from publicly available records. To have your information removed, we recommend requesting removal directly through your county’s website.
| Year | Tax Paid | Tax Assessment Tax Assessment Total Assessment is a certain percentage of the fair market value that is determined by local assessors to be the total taxable value of land and additions on the property. | Land | Improvement |
|---|---|---|---|---|
| 2025 | $7,115 | $436,800 | $317,100 | $119,700 |
| 2024 | $6,671 | $406,500 | $282,000 | $124,500 |
| 2023 | $6,372 | $378,400 | $265,900 | $112,500 |
| 2022 | $6,007 | $324,900 | $224,900 | $100,000 |
| 2021 | $5,842 | $315,100 | $215,100 | $100,000 |
| 2020 | $5,503 | $300,400 | $197,500 | $102,900 |
| 2019 | $5,198 | $283,600 | $199,400 | $84,200 |
| 2018 | $4,781 | $259,000 | $191,600 | $67,400 |
| 2017 | $4,610 | $259,000 | $191,600 | $67,400 |
| 2016 | $4,338 | $244,100 | $176,000 | $68,100 |
| 2015 | $4,185 | $225,100 | $156,400 | $68,700 |
Seller's Agent in 2025
Christopher Buono
All Things Real Estate, Inc.
(781) 820-9722
70 Total Sales
V
Seller Co-Listing Agent in 2025
Valentin TenBrook
All Things Real Estate, Inc.
(781) 715-4834
3 Total Sales
Buyer's Agent in 2025
Janet Wu Cook
Keller Williams Elite
(508) 361-9355
111 Total Sales
Seller's Agent in 2012
Mary Christensen
RE/MAX
(508) 868-5483
33 Total Sales
E
Buyer's Agent in 2012
Erika Carpenter
John J. Carpenter, Esq & Associates Real Estate
Source: MLS Property Information Network (MLS PIN)
MLS Number: 73339432
APN: WBOR-000027-000139
Disclaimer: Certain information contained herein is derived from information provided by parties other than Homes.com. All information provided is deemed reliable, but is not guaranteed to be accurate and should be independently verified.
![]() The property listing data and information, or the Images, set forth herein were provided to MLS Property Information Network, Inc. from third party sources, including sellers, lessors and public records, and were compiled by MLS Property Information Network, Inc. The property listing data and information, and the Images, are for the personal, non-commercial use of consumers having a good faith interest in purchasing or leasing listed properties of the type displayed to them and may not be used for any purpose other than to identify prospective properties which such consumers may have a good faith interest in purchasing or leasing. MLS Property Information Network, Inc. and its subscribers disclaim any and all representations and warranties as to the accuracy of the property listing data and information, or as to the accuracy of any of the Images, set forth herein.
The property listing data and information, or the Images, set forth herein were provided to MLS Property Information Network, Inc. from third party sources, including sellers, lessors and public records, and were compiled by MLS Property Information Network, Inc. The property listing data and information, and the Images, are for the personal, non-commercial use of consumers having a good faith interest in purchasing or leasing listed properties of the type displayed to them and may not be used for any purpose other than to identify prospective properties which such consumers may have a good faith interest in purchasing or leasing. MLS Property Information Network, Inc. and its subscribers disclaim any and all representations and warranties as to the accuracy of the property listing data and information, or as to the accuracy of any of the Images, set forth herein.
Ask me questions while you tour the home.