9 Rutgers St Closter, NJ 07624
Estimated Value: $1,657,000 - $2,223,453
6
Beds
6
Baths
4,386
Sq Ft
$417/Sq Ft
Est. Value
About This Home
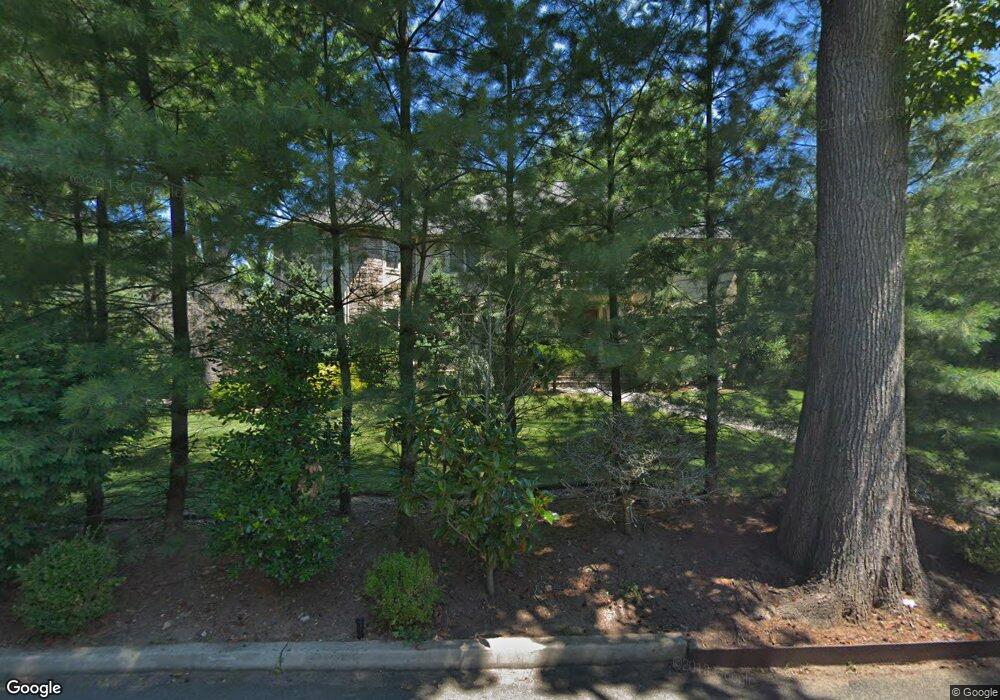
This home is located at 9 Rutgers St, Closter, NJ 07624 and is currently estimated at $1,828,863, approximately $416 per square foot. 9 Rutgers St is a home located in Bergen County with nearby schools including Hillside Elementary School, Tenakill Middle School, and Northern Valley Regional High School at Demarest.
Ownership History
Date
Name
Owned For
Owner Type
Purchase Details
Closed on
Nov 10, 2006
Sold by
Katznelson Michael
Bought by
Moalem Shlomo and Moalem Karen
Current Estimated Value
Home Financials for this Owner
Home Financials are based on the most recent Mortgage that was taken out on this home.
Original Mortgage
$850,000
Outstanding Balance
$507,854
Interest Rate
6.39%
Estimated Equity
$1,321,009
Purchase Details
Closed on
Jul 23, 2004
Sold by
Schwartz Andrew
Bought by
Katznelson Michael
Create a Home Valuation Report for This Property
The Home Valuation Report is an in-depth analysis detailing your home's value as well as a comparison with similar homes in the area
Home Values in the Area
Average Home Value in this Area
Purchase History
| Date | Buyer | Sale Price | Title Company |
|---|---|---|---|
| Moalem Shlomo | $1,645,000 | -- | |
| Katznelson Michael | $605,000 | -- |
Source: Public Records
Mortgage History
| Date | Status | Borrower | Loan Amount |
|---|---|---|---|
| Open | Moalem Shlomo | $850,000 |
Source: Public Records
Tax History Compared to Growth
Tax History
| Year | Tax Paid | Tax Assessment Tax Assessment Total Assessment is a certain percentage of the fair market value that is determined by local assessors to be the total taxable value of land and additions on the property. | Land | Improvement |
|---|---|---|---|---|
| 2025 | $34,328 | $1,692,700 | $603,200 | $1,089,500 |
| 2024 | $33,654 | $1,622,300 | $580,700 | $1,041,600 |
| 2023 | $32,510 | $1,569,700 | $555,700 | $1,014,000 |
| 2022 | $32,510 | $1,469,700 | $512,000 | $957,700 |
| 2021 | $30,014 | $1,401,800 | $492,000 | $909,800 |
| 2020 | $34,083 | $1,520,900 | $494,500 | $1,026,400 |
| 2019 | $33,213 | $1,498,100 | $487,000 | $1,011,100 |
| 2018 | $33,038 | $1,484,200 | $480,000 | $1,004,200 |
| 2017 | $32,859 | $1,439,900 | $458,400 | $981,500 |
| 2016 | $32,239 | $1,439,900 | $458,400 | $981,500 |
| 2015 | $31,534 | $1,439,900 | $458,400 | $981,500 |
| 2014 | $30,655 | $1,439,900 | $458,400 | $981,500 |
Source: Public Records
Map
Nearby Homes
- 2 Eisenhower Rd
- 77 Rutgers St
- 25 Piermont Rd
- 90 Dyer Ct
- 305 Westwind Ct
- 358 Ruckman Rd
- 75 Susan Dr
- 54 Mohawk Ave
- 304 Piermont Rd
- 215 Beech Ct Unit T046
- 216 Beech Ct
- 814 Hemlock Ct
- 844 Hemlock Ct Unit T169
- 84 Briarwood Ave
- 186 Hickory Ln
- 8 Church Ct
- 125 Livingston St
- 36 Buckingham Dr
- 155 Closter Dock Rd
- 28 Buckingham Dr