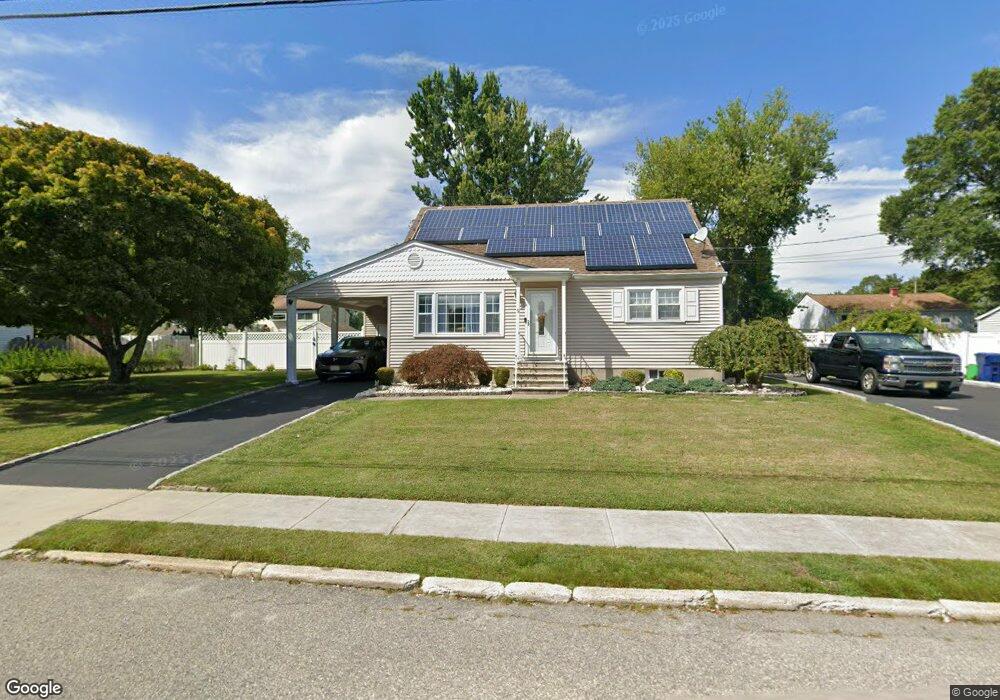
9 Rutgers Terrace Neptune, NJ 07753
Estimated Value: $511,000 - $590,000
4
Beds
2
Baths
1,523
Sq Ft
$361/Sq Ft
Est. Value
About This Home
This home is located at 9 Rutgers Terrace, Neptune, NJ 07753 and is currently estimated at $550,407, approximately $361 per square foot. 9 Rutgers Terrace is a home located in Monmouth County with nearby schools including Neptune High School, Our Lady of Mount Carmel School, and Ilan High School.
Ownership History
Date
Name
Owned For
Owner Type
Purchase Details
Closed on
Nov 28, 2023
Sold by
Borden Susan
Bought by
Borden Susan Anne and Borden Charles
Current Estimated Value
Purchase Details
Closed on
Jun 9, 2020
Sold by
Bryant Mary C
Bought by
Borden Charles and Borden Susan
Home Financials for this Owner
Home Financials are based on the most recent Mortgage that was taken out on this home.
Original Mortgage
$239,920
Interest Rate
3.2%
Mortgage Type
New Conventional
Purchase Details
Closed on
Jun 1, 2001
Sold by
Yannetta Frederick
Bought by
Bryant Mary
Home Financials for this Owner
Home Financials are based on the most recent Mortgage that was taken out on this home.
Original Mortgage
$107,900
Interest Rate
7.2%
Create a Home Valuation Report for This Property
The Home Valuation Report is an in-depth analysis detailing your home's value as well as a comparison with similar homes in the area
Home Values in the Area
Average Home Value in this Area
Purchase History
| Date | Buyer | Sale Price | Title Company |
|---|---|---|---|
| Borden Susan Anne | -- | None Listed On Document | |
| Borden Susan Anne | -- | None Listed On Document | |
| Borden Charles | $299,900 | Pinnacle Land And Title Inc | |
| Bryant Mary | $142,900 | -- |
Source: Public Records
Mortgage History
| Date | Status | Borrower | Loan Amount |
|---|---|---|---|
| Previous Owner | Borden Charles | $239,920 | |
| Previous Owner | Bryant Mary | $107,900 |
Source: Public Records
Tax History Compared to Growth
Tax History
| Year | Tax Paid | Tax Assessment Tax Assessment Total Assessment is a certain percentage of the fair market value that is determined by local assessors to be the total taxable value of land and additions on the property. | Land | Improvement |
|---|---|---|---|---|
| 2025 | $8,562 | $464,000 | $245,100 | $218,900 |
| 2024 | $7,479 | $489,000 | $274,100 | $214,900 |
| 2023 | $7,479 | $414,100 | $204,300 | $209,800 |
| 2022 | $6,383 | $374,000 | $160,700 | $213,300 |
| 2021 | $5,661 | $302,100 | $138,100 | $164,000 |
| 2020 | $5,716 | $269,900 | $138,100 | $131,800 |
| 2019 | $5,661 | $263,900 | $140,300 | $123,600 |
| 2018 | $5,464 | $251,800 | $129,100 | $122,700 |
| 2017 | $5,347 | $236,700 | $123,100 | $113,600 |
| 2016 | $5,506 | $243,100 | $123,100 | $120,000 |
| 2015 | $5,699 | $255,900 | $138,900 | $117,000 |
| 2014 | $5,884 | $217,200 | $123,900 | $93,300 |
Source: Public Records
Map
Nearby Homes
- 1100 Green Grove Rd
- 224 Cold Indian Springs Rd Unit B
- 1961 Jumping Brook Rd
- 2 Kenneth Terrace
- 8 Norman Dr
- 24 Oxford Dr
- 216 Fairway Ln
- 4 White Dr
- 9 Violet Dr
- 725 Gail Dr
- 8 Arbor Way
- 115 Cold Indian Springs Rd
- 12 Standish Dr
- 1 Alfred Ct
- 7 Centre St Unit 2109
- 20 Buckingham Dr
- 345 Green Grove Rd
- 2 Carol Ave
- 10 Lambert Johnson Dr
- 3 Manor Dr
- 4 Margert Ave
- 11 Rutgers Terrace
- 6 Margert Ave
- 2 Margert Ave
- 12 Rutgers Terrace
- 8 Rutgers Terrace
- 5 Rutgers Terrace
- 15 Rutgers Terrace
- 8 Margert Ave
- 1 Margert Ave
- 3 Margert Ave
- 1 Murray Ln
- 14 Rutgers Terrace
- 6 Rutgers Terrace
- 2 Milton Ln
- 11 Smith Ln
- 13 Smith Ln
- 3 Rutgers Terrace
- 2 Rutgers Terrace
- 2 Russex Rd