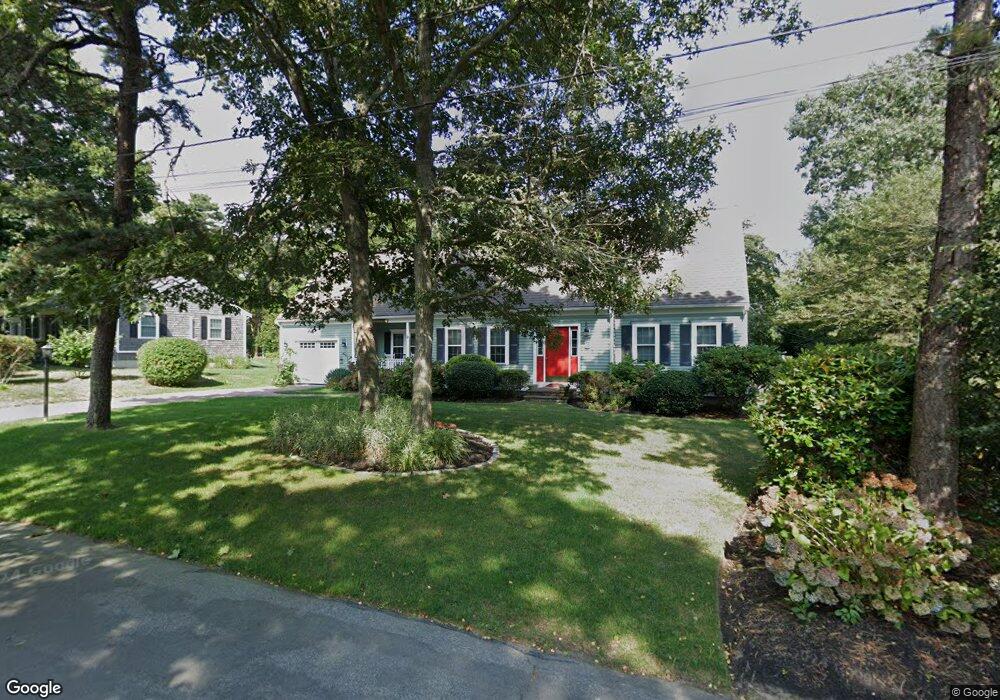
9 Ruth Ln Harwich, MA 02645
Harwich Center NeighborhoodEstimated Value: $893,333 - $1,003,000
3
Beds
3
Baths
2,066
Sq Ft
$459/Sq Ft
Est. Value
About This Home
This home is located at 9 Ruth Ln, Harwich, MA 02645 and is currently estimated at $947,833, approximately $458 per square foot. 9 Ruth Ln is a home located in Barnstable County with nearby schools including Harwich Elementary School, Chatham Elementary School, and Monomoy Regional Middle School.
Ownership History
Date
Name
Owned For
Owner Type
Purchase Details
Closed on
May 16, 2019
Sold by
Furbush Robert C and Furbush Emily A
Bought by
Furbush Ft
Current Estimated Value
Purchase Details
Closed on
Jul 3, 2003
Sold by
Walden Corp
Bought by
Furbush Robert C and Furbush Emily A
Home Financials for this Owner
Home Financials are based on the most recent Mortgage that was taken out on this home.
Original Mortgage
$320,000
Interest Rate
5.46%
Mortgage Type
Purchase Money Mortgage
Purchase Details
Closed on
Mar 5, 2003
Sold by
Wood Alice C
Bought by
Walden Corp
Home Financials for this Owner
Home Financials are based on the most recent Mortgage that was taken out on this home.
Original Mortgage
$250,000
Interest Rate
5.95%
Mortgage Type
Purchase Money Mortgage
Create a Home Valuation Report for This Property
The Home Valuation Report is an in-depth analysis detailing your home's value as well as a comparison with similar homes in the area
Home Values in the Area
Average Home Value in this Area
Purchase History
| Date | Buyer | Sale Price | Title Company |
|---|---|---|---|
| Furbush Ft | -- | -- | |
| Furbush Robert C | $400,000 | -- | |
| Walden Corp | $160,000 | -- |
Source: Public Records
Mortgage History
| Date | Status | Borrower | Loan Amount |
|---|---|---|---|
| Previous Owner | Walden Corp | $320,000 | |
| Previous Owner | Walden Corp | $250,000 |
Source: Public Records
Tax History
| Year | Tax Paid | Tax Assessment Tax Assessment Total Assessment is a certain percentage of the fair market value that is determined by local assessors to be the total taxable value of land and additions on the property. | Land | Improvement |
|---|---|---|---|---|
| 2025 | $4,926 | $833,500 | $199,900 | $633,600 |
| 2024 | $4,785 | $793,600 | $188,600 | $605,000 |
| 2023 | $4,550 | $685,200 | $171,500 | $513,700 |
| 2022 | $4,417 | $544,600 | $149,100 | $395,500 |
| 2021 | $4,325 | $502,900 | $135,600 | $367,300 |
| 2020 | $4,293 | $491,800 | $132,700 | $359,100 |
| 2019 | $4,110 | $474,000 | $126,600 | $347,400 |
| 2018 | $4,059 | $447,800 | $115,100 | $332,700 |
| 2017 | $3,839 | $428,000 | $104,900 | $323,100 |
| 2016 | $3,753 | $413,800 | $104,900 | $308,900 |
| 2015 | $3,731 | $415,900 | $102,800 | $313,100 |
| 2014 | $3,572 | $407,300 | $99,700 | $307,600 |
Source: Public Records
Map
Nearby Homes
- 19 Larkin Ln
- 44 Beriah Brooks Rd
- 9 Jason Ln
- 820 Massachusetts 28
- 26 Pleasant Lake Ave Unit 16
- 52, 50, 48 Braddock St
- 54 Marthas Ln
- 58 Marthas Ln
- 27 Quaker Ln
- 13 Allen St
- 135 Sisson Rd
- 515 Route 28
- 515 Massachusetts 28
- 4 Berry Ln
- 7 Sea St
- 10 Notre Dame Ave
- 4 Lake St
- 6 Marthas Ln
- 5 Rocky Way
- 14 Harold St Unit 13A
Your Personal Tour Guide
Ask me questions while you tour the home.