Estimated Value: $109,000 - $144,221
2
Beds
1
Bath
1,113
Sq Ft
$116/Sq Ft
Est. Value
About This Home
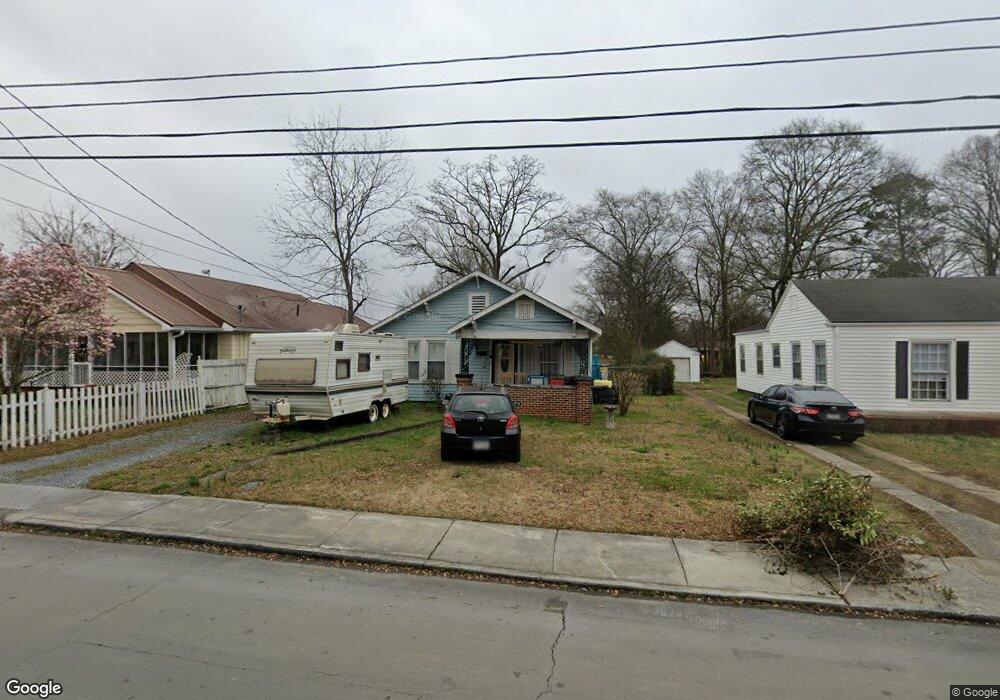
This home is located at 9 S Elm St SW, Rome, GA 30165 and is currently estimated at $129,055, approximately $115 per square foot. 9 S Elm St SW is a home located in Floyd County with nearby schools including Rome High School and St. Mary School.
Ownership History
Date
Name
Owned For
Owner Type
Purchase Details
Closed on
Mar 4, 2010
Bought by
P and R
Current Estimated Value
Purchase Details
Closed on
Mar 30, 1992
Sold by
Shadrick Joann O
Bought by
Ayers Debra Helene
Purchase Details
Closed on
Dec 14, 1984
Sold by
Levins Eudora Parks Eudora L
Bought by
Shadrick Joann O
Purchase Details
Closed on
Jan 10, 1975
Sold by
Atkinson Larry B and Atkinson Teresa
Bought by
Levins Eudora Parks Eudora L
Purchase Details
Closed on
Jan 30, 1973
Sold by
James E S
Bought by
Atkinson Larry B and Atkinson Teresa
Purchase Details
Closed on
Dec 16, 1969
Sold by
Wade Eniz Inez
Bought by
James E S
Purchase Details
Closed on
Oct 13, 1969
Sold by
Levins Wm T
Bought by
Wade Eniz Inez
Purchase Details
Closed on
Feb 5, 1965
Sold by
Bobo Alan W
Bought by
Levins Wm T
Purchase Details
Closed on
Jan 1, 1901
Bought by
Bobo Alan W
Create a Home Valuation Report for This Property
The Home Valuation Report is an in-depth analysis detailing your home's value as well as a comparison with similar homes in the area
Home Values in the Area
Average Home Value in this Area
Purchase History
| Date | Buyer | Sale Price | Title Company |
|---|---|---|---|
| P | -- | -- | |
| Ayers Debra Helene | -- | -- | |
| Shadrick Joann O | $19,000 | -- | |
| Levins Eudora Parks Eudora L | -- | -- | |
| Atkinson Larry B | $11,500 | -- | |
| James E S | $8,000 | -- | |
| Wade Eniz Inez | $10,000 | -- | |
| Levins Wm T | $8,600 | -- | |
| Bobo Alan W | -- | -- |
Source: Public Records
Tax History Compared to Growth
Tax History
| Year | Tax Paid | Tax Assessment Tax Assessment Total Assessment is a certain percentage of the fair market value that is determined by local assessors to be the total taxable value of land and additions on the property. | Land | Improvement |
|---|---|---|---|---|
| 2024 | $207 | $37,050 | $5,940 | $31,110 |
| 2023 | $790 | $35,047 | $5,280 | $29,767 |
| 2022 | $709 | $28,981 | $4,400 | $24,581 |
| 2021 | $660 | $26,028 | $4,400 | $21,628 |
| 2020 | $622 | $23,646 | $3,300 | $20,346 |
| 2019 | $596 | $22,340 | $3,300 | $19,040 |
| 2018 | $573 | $21,059 | $3,300 | $17,759 |
| 2017 | $560 | $20,278 | $3,300 | $16,978 |
| 2016 | $576 | $21,136 | $3,280 | $17,856 |
| 2015 | $554 | $21,136 | $3,280 | $17,856 |
| 2014 | $554 | $21,136 | $3,280 | $17,856 |
Source: Public Records
Map
Nearby Homes
- 8 S Hughes St SW
- 204 Cherry St SW
- 8 Leon St SW
- 21 Sweetspire Dr NW
- 23 Sweetspire Dr NW
- 15 Silverbell Ln
- 50 Melton Ave SW
- 214 N Elm St NW
- 0 Mount Alto Rd SW Unit 10523740
- 100 Dellwood Dr NW
- 40 Paris Dr SW
- 13 Ridgewood Rd SW
- 14 Berckman Ln SW
- 3 Berckman Ln SW
- 19 Berckman Ln SW
- 311 Wilkerson Rd SW
- 313 Wilkerson Rd SW
- 55 Ridgewood Rd SW
- 207 Paris Dr SW
- 209 Sherwood Rd SW
- 9 S Elm St SW
- 11 S Elm St SW
- 7 S Elm St SW
- 13 S Elm St SW
- 17 S Elm St SW
- 10 Cherry St SW
- 6 Cherry St SW
- 100 S Elm St SW
- 101 S Elm St SW
- 12 Cherry St SW
- 14 Cherry St SW
- 0 S Elm St SW Unit 1/2
- 102 S Elm St SW
- 103 S Elm St SW
- 18 Cherry St SW
- 1007 Ethel Ave SW
- 104 S Elm St SW
- 105 S Elm St SW
- 7 S Sycamore St SW
- 1009 Ethel Ave SW