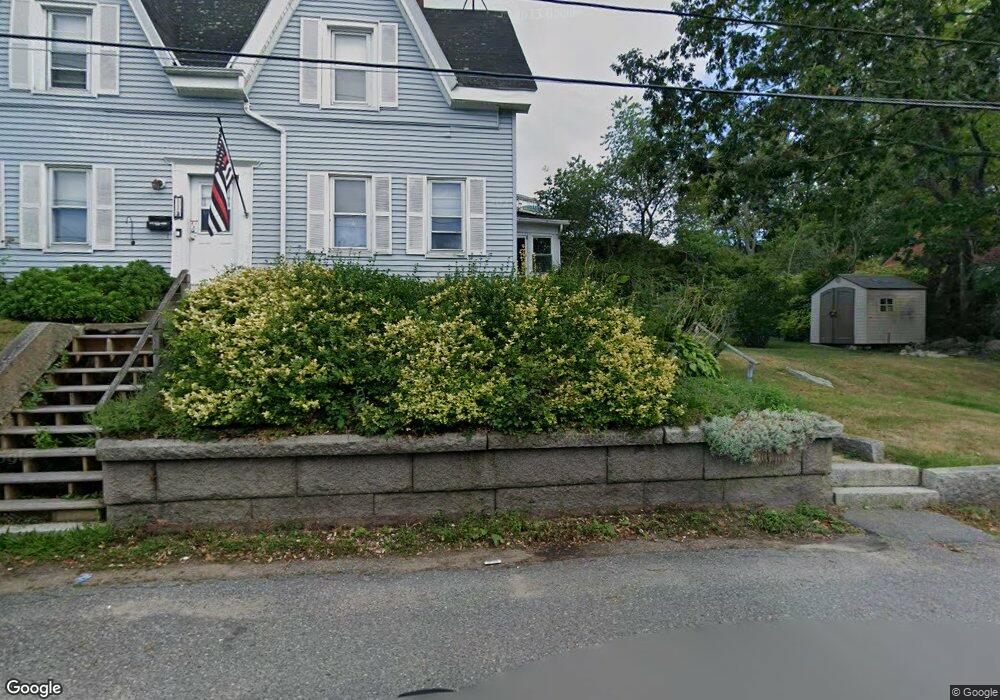
9 Sayward St Gloucester, MA 01930
East Gloucester NeighborhoodEstimated Value: $548,000 - $700,000
5
Beds
2
Baths
2,155
Sq Ft
$287/Sq Ft
Est. Value
About This Home
This home is located at 9 Sayward St, Gloucester, MA 01930 and is currently estimated at $618,642, approximately $287 per square foot. 9 Sayward St is a home located in Essex County with nearby schools including East Gloucester Elementary School, Ralph B O'maley Middle School, and Gloucester High School.
Ownership History
Date
Name
Owned For
Owner Type
Purchase Details
Closed on
Mar 8, 2022
Sold by
Rowe Bernice E
Bought by
Rowe William J and Rowe Scott M
Current Estimated Value
Purchase Details
Closed on
Sep 28, 2020
Sold by
Rowe Bernice E and Rowe William J
Bought by
Rowe Bernice E
Purchase Details
Closed on
Mar 31, 2011
Sold by
Rowe William J and Rowe Bernice E
Bought by
Gloucester City Of
Create a Home Valuation Report for This Property
The Home Valuation Report is an in-depth analysis detailing your home's value as well as a comparison with similar homes in the area
Home Values in the Area
Average Home Value in this Area
Purchase History
We collect this data history from publicly available records. To have your information removed, we recommend requesting removal directly through your county’s website.
| Date | Buyer | Sale Price | Title Company |
|---|---|---|---|
| Rowe William J | -- | None Available | |
| Rowe Bernice E | -- | None Available | |
| Gloucester City Of | $1,946 | -- |
Source: Public Records
Mortgage History
We collect this data history from publicly available records. To have your information removed, we recommend requesting removal directly through your county’s website.
| Date | Status | Borrower | Loan Amount |
|---|---|---|---|
| Previous Owner | Gloucester City Of | $193,350 | |
| Previous Owner | Gloucester City Of | $37,078 | |
| Previous Owner | Gloucester City Of | $148,418 | |
| Previous Owner | Gloucester City Of | $19,000 |
Source: Public Records
Tax History
| Year | Tax Paid | Tax Assessment Tax Assessment Total Assessment is a certain percentage of the fair market value that is determined by local assessors to be the total taxable value of land and additions on the property. | Land | Improvement |
|---|---|---|---|---|
| 2025 | $5,212 | $536,200 | $185,300 | $350,900 |
| 2024 | $5,125 | $526,700 | $176,400 | $350,300 |
| 2023 | $5,429 | $512,700 | $157,500 | $355,200 |
| 2022 | $4,942 | $421,300 | $137,000 | $284,300 |
| 2021 | $4,349 | $349,600 | $124,600 | $225,000 |
| 2020 | $4,270 | $346,300 | $124,600 | $221,700 |
| 2019 | $4,289 | $338,000 | $124,600 | $213,400 |
| 2018 | $4,051 | $313,300 | $124,600 | $188,700 |
| 2017 | $3,879 | $294,100 | $118,600 | $175,500 |
| 2016 | $3,853 | $283,100 | $123,800 | $159,300 |
| 2015 | $3,796 | $278,100 | $123,800 | $154,300 |
Source: Public Records
Map
Nearby Homes
- 8 Blake Ct
- 4 Graystone Rd
- 5 Mount Pleasant Ave
- 2 Harrison Ave
- 8 Atlantic Rd
- 197 E Main St Unit 1
- 141 Prospect St
- 141 Prospect St Unit B
- 141 Prospect St Unit A
- 14R Spring St Unit 3
- 274 Main St Unit 4
- 64 Rocky Neck Ave Unit A
- 64 Rocky Neck Ave Unit B
- 60 Rocky Neck Ave Unit 202
- 140 Mount Pleasant Ave
- 196 Main St Unit 2
- 191 Main St Unit 2A
- 19 Trask St Unit 1
- 263 E Main St
- 113 Pleasant St
Your Personal Tour Guide
Ask me questions while you tour the home.