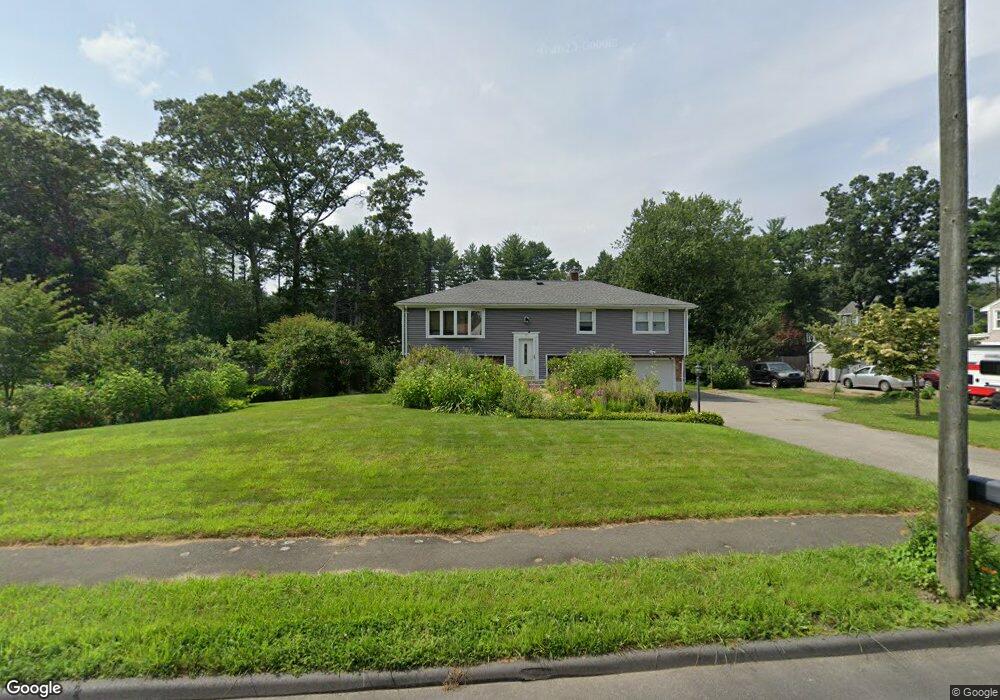
9 Scaltrito Dr Wilmington, MA 01887
Estimated Value: $725,000 - $794,000
4
Beds
3
Baths
2,212
Sq Ft
$340/Sq Ft
Est. Value
About This Home
This home is located at 9 Scaltrito Dr, Wilmington, MA 01887 and is currently estimated at $752,668, approximately $340 per square foot. 9 Scaltrito Dr is a home located in Middlesex County with nearby schools including Heath-Brook Elementary School and Abundant Life Christian School and Childcare.
Ownership History
Date
Name
Owned For
Owner Type
Purchase Details
Closed on
Jan 18, 2002
Sold by
Tousignant Daniel J and Tousignant Julie A
Bought by
Rega Joseph D
Current Estimated Value
Home Financials for this Owner
Home Financials are based on the most recent Mortgage that was taken out on this home.
Original Mortgage
$205,000
Outstanding Balance
$81,709
Interest Rate
6.84%
Mortgage Type
Purchase Money Mortgage
Estimated Equity
$670,959
Purchase Details
Closed on
Oct 21, 1998
Sold by
Conti James A and Conti Heather M
Bought by
Tousignant Daniel J
Home Financials for this Owner
Home Financials are based on the most recent Mortgage that was taken out on this home.
Original Mortgage
$250,000
Interest Rate
6.74%
Mortgage Type
Purchase Money Mortgage
Create a Home Valuation Report for This Property
The Home Valuation Report is an in-depth analysis detailing your home's value as well as a comparison with similar homes in the area
Home Values in the Area
Average Home Value in this Area
Purchase History
| Date | Buyer | Sale Price | Title Company |
|---|---|---|---|
| Rega Joseph D | $341,000 | -- | |
| Tousignant Daniel J | $265,000 | -- |
Source: Public Records
Mortgage History
| Date | Status | Borrower | Loan Amount |
|---|---|---|---|
| Open | Tousignant Daniel J | $205,000 | |
| Previous Owner | Tousignant Daniel J | $250,000 | |
| Previous Owner | Tousignant Daniel J | $25,000 | |
| Previous Owner | Tousignant Daniel J | $125,000 |
Source: Public Records
Tax History Compared to Growth
Tax History
| Year | Tax Paid | Tax Assessment Tax Assessment Total Assessment is a certain percentage of the fair market value that is determined by local assessors to be the total taxable value of land and additions on the property. | Land | Improvement |
|---|---|---|---|---|
| 2025 | $7,762 | $677,900 | $313,600 | $364,300 |
| 2024 | $7,647 | $669,000 | $313,600 | $355,400 |
| 2023 | $7,392 | $619,100 | $285,100 | $334,000 |
| 2022 | $7,041 | $540,400 | $237,500 | $302,900 |
| 2021 | $6,935 | $501,100 | $215,900 | $285,200 |
| 2020 | $7,370 | $542,700 | $215,900 | $326,800 |
| 2019 | $6,806 | $495,000 | $205,600 | $289,400 |
| 2018 | $6,389 | $443,400 | $195,800 | $247,600 |
| 2017 | $6,274 | $434,200 | $195,800 | $238,400 |
| 2016 | $5,890 | $402,600 | $186,600 | $216,000 |
| 2015 | $5,498 | $382,600 | $186,600 | $196,000 |
| 2014 | $5,173 | $363,300 | $177,700 | $185,600 |
Source: Public Records
Map
Nearby Homes