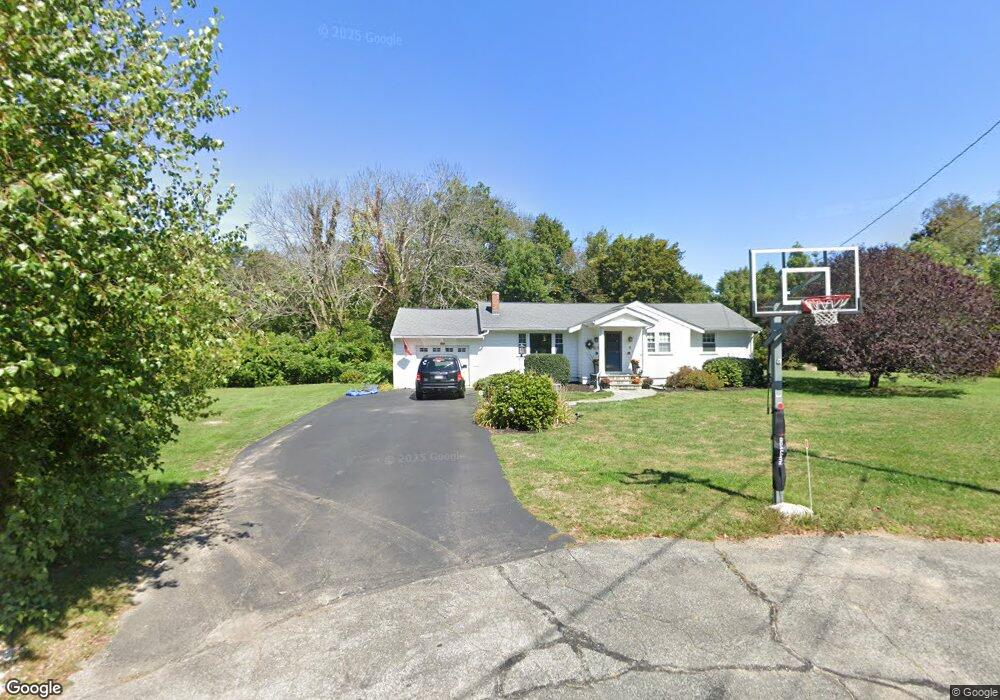
9 Seaboard Cir Scituate, MA 02066
Estimated Value: $817,000 - $922,000
3
Beds
1
Bath
1,206
Sq Ft
$717/Sq Ft
Est. Value
About This Home
This home is located at 9 Seaboard Cir, Scituate, MA 02066 and is currently estimated at $864,556, approximately $716 per square foot. 9 Seaboard Cir is a home located in Plymouth County with nearby schools including Cushing Elementary School, Lester J. Gates Middle School, and Scituate High School.
Ownership History
Date
Name
Owned For
Owner Type
Purchase Details
Closed on
May 6, 2021
Sold by
Carr Patrick A and Carr Victoria L
Bought by
Carr Ret
Current Estimated Value
Purchase Details
Closed on
Jul 14, 1998
Sold by
Est Sutherland Alfred and Giovannucci Karen E
Bought by
Carr Patrick A and Gordon Victoria L
Create a Home Valuation Report for This Property
The Home Valuation Report is an in-depth analysis detailing your home's value as well as a comparison with similar homes in the area
Home Values in the Area
Average Home Value in this Area
Purchase History
| Date | Buyer | Sale Price | Title Company |
|---|---|---|---|
| Carr Ret | -- | None Available | |
| Carr Patrick A | $189,900 | -- |
Source: Public Records
Mortgage History
| Date | Status | Borrower | Loan Amount |
|---|---|---|---|
| Previous Owner | Carr Patrick A | $372,811 | |
| Previous Owner | Carr Patrick A | $349,918 | |
| Previous Owner | Carr Patrick A | $169,000 |
Source: Public Records
Tax History Compared to Growth
Tax History
| Year | Tax Paid | Tax Assessment Tax Assessment Total Assessment is a certain percentage of the fair market value that is determined by local assessors to be the total taxable value of land and additions on the property. | Land | Improvement |
|---|---|---|---|---|
| 2025 | $6,849 | $685,600 | $380,700 | $304,900 |
| 2024 | $6,729 | $649,500 | $346,100 | $303,400 |
| 2023 | $6,951 | $605,900 | $332,100 | $273,800 |
| 2022 | $6,951 | $550,800 | $302,400 | $248,400 |
| 2021 | $6,677 | $500,900 | $288,000 | $212,900 |
| 2020 | $6,373 | $472,100 | $276,900 | $195,200 |
| 2019 | $6,296 | $458,200 | $271,400 | $186,800 |
| 2018 | $5,936 | $425,500 | $270,700 | $154,800 |
| 2017 | $5,836 | $414,200 | $259,400 | $154,800 |
| 2016 | $5,537 | $391,600 | $236,800 | $154,800 |
| 2015 | $4,983 | $380,400 | $225,600 | $154,800 |
Source: Public Records
Map
Nearby Homes