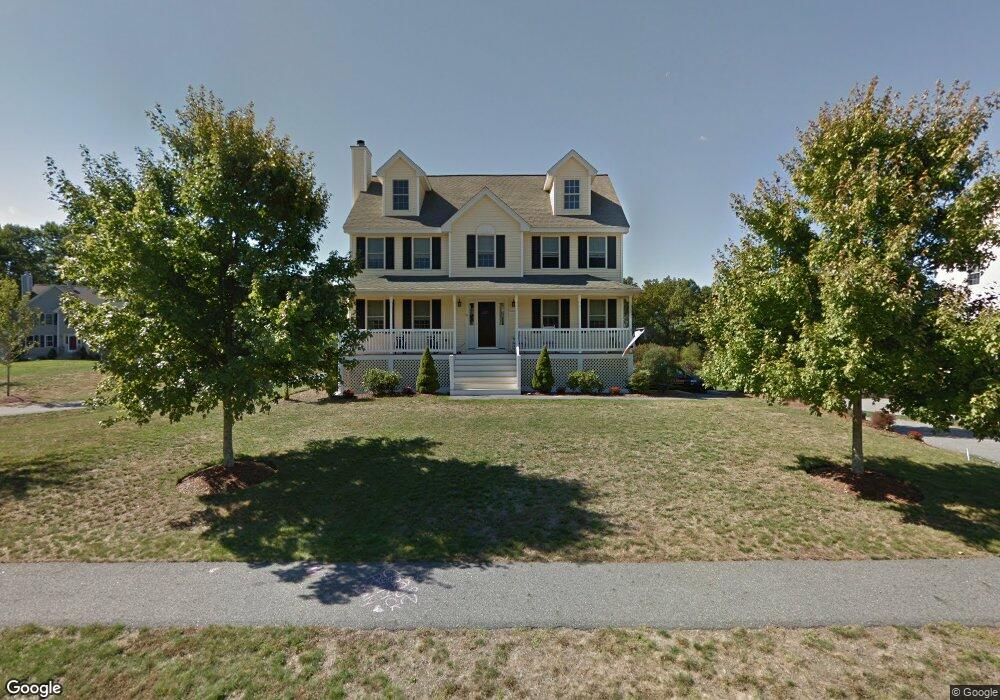
9 Sequoia Dr Wilmington, MA 01887
Estimated Value: $937,427 - $1,028,000
3
Beds
3
Baths
1,986
Sq Ft
$491/Sq Ft
Est. Value
About This Home
This home is located at 9 Sequoia Dr, Wilmington, MA 01887 and is currently estimated at $975,857, approximately $491 per square foot. 9 Sequoia Dr is a home located in Middlesex County with nearby schools including Wilmington Middle School, Wilmington High School, and Abundant Life Christian School and Childcare.
Ownership History
Date
Name
Owned For
Owner Type
Purchase Details
Closed on
Mar 9, 2006
Sold by
Northeastern Dev Corp
Bought by
Thompson Kimberly
Current Estimated Value
Home Financials for this Owner
Home Financials are based on the most recent Mortgage that was taken out on this home.
Original Mortgage
$471,920
Outstanding Balance
$266,394
Interest Rate
6.15%
Mortgage Type
Purchase Money Mortgage
Estimated Equity
$709,463
Create a Home Valuation Report for This Property
The Home Valuation Report is an in-depth analysis detailing your home's value as well as a comparison with similar homes in the area
Purchase History
| Date | Buyer | Sale Price | Title Company |
|---|---|---|---|
| Thompson Kimberly | $589,900 | -- |
Source: Public Records
Mortgage History
| Date | Status | Borrower | Loan Amount |
|---|---|---|---|
| Open | Thompson Kimberly | $471,920 |
Source: Public Records
Tax History
| Year | Tax Paid | Tax Assessment Tax Assessment Total Assessment is a certain percentage of the fair market value that is determined by local assessors to be the total taxable value of land and additions on the property. | Land | Improvement |
|---|---|---|---|---|
| 2025 | $9,691 | $846,400 | $344,600 | $501,800 |
| 2024 | $9,503 | $831,400 | $344,600 | $486,800 |
| 2023 | $8,635 | $723,200 | $292,400 | $430,800 |
| 2022 | $8,142 | $624,900 | $243,600 | $381,300 |
| 2021 | $8,178 | $590,900 | $221,400 | $369,500 |
| 2020 | $7,938 | $584,500 | $221,400 | $363,100 |
| 2019 | $7,871 | $572,400 | $216,500 | $355,900 |
| 2018 | $7,774 | $539,500 | $206,300 | $333,200 |
| 2017 | $7,660 | $530,100 | $206,300 | $323,800 |
| 2016 | $7,201 | $492,200 | $196,500 | $295,700 |
| 2015 | $6,980 | $485,700 | $196,500 | $289,200 |
| 2014 | $6,595 | $463,100 | $187,200 | $275,900 |
Source: Public Records
Map
Nearby Homes
- 584 Woburn St
- 41 Marcus Rd
- 21 Marcia Rd
- 15 Mystic Ave
- 203 Lowell St Unit 316
- 203 Lowell St Unit 218
- 203 Lowell St Unit 120
- 3 Molloy Rd
- 9 Parker St
- 150 Grove St
- 7 Cross St Unit 303
- 7 Cross St Unit 304
- 7 Cross St Unit 205
- 7 Cross St Unit 102
- 17 Carson Ave
- 10 Pilling Rd
- 68 Sanborn Ln
- 119 Van Norden Rd
- 12 Hamlin Ln
- 28 Nutter Rd
Your Personal Tour Guide
Ask me questions while you tour the home.