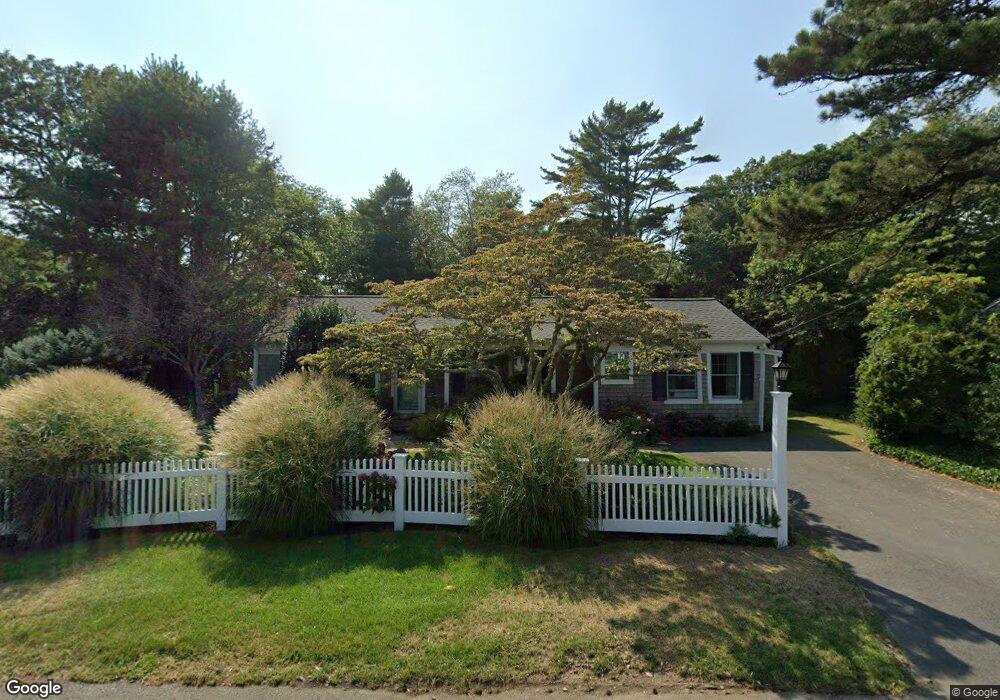
9 Shannon Rd Harwich, MA 02645
Harwich Center NeighborhoodEstimated Value: $566,068 - $626,000
2
Beds
1
Bath
1,264
Sq Ft
$466/Sq Ft
Est. Value
About This Home
This home is located at 9 Shannon Rd, Harwich, MA 02645 and is currently estimated at $589,267, approximately $466 per square foot. 9 Shannon Rd is a home located in Barnstable County with nearby schools including Harwich Elementary School, Chatham Elementary School, and Monomoy Regional Middle School.
Ownership History
Date
Name
Owned For
Owner Type
Purchase Details
Closed on
Oct 20, 2021
Sold by
Christiansen Karen D and Christiansen Lawrence K
Bought by
Christiansen Rt
Current Estimated Value
Purchase Details
Closed on
Mar 24, 2020
Sold by
Christiansen Rt
Bought by
Christiansen Lawrence K and Christiansen Karen D
Purchase Details
Closed on
May 12, 2010
Sold by
Marie S Drexler Ret
Bought by
Christiansen Lawrence K and Christiansen Karen D
Purchase Details
Closed on
Jun 23, 2004
Sold by
Drexler Marie S
Bought by
Marie S Drexle Lt
Create a Home Valuation Report for This Property
The Home Valuation Report is an in-depth analysis detailing your home's value as well as a comparison with similar homes in the area
Home Values in the Area
Average Home Value in this Area
Purchase History
| Date | Buyer | Sale Price | Title Company |
|---|---|---|---|
| Christiansen Rt | -- | None Available | |
| Christiansen Lawrence K | -- | None Available | |
| Christiansen Lawrence K | -- | -- | |
| Marie S Drexle Lt | -- | -- |
Source: Public Records
Tax History Compared to Growth
Tax History
| Year | Tax Paid | Tax Assessment Tax Assessment Total Assessment is a certain percentage of the fair market value that is determined by local assessors to be the total taxable value of land and additions on the property. | Land | Improvement |
|---|---|---|---|---|
| 2025 | $2,915 | $493,200 | $199,600 | $293,600 |
| 2024 | $2,829 | $469,100 | $188,300 | $280,800 |
| 2023 | $2,740 | $412,600 | $171,200 | $241,400 |
| 2022 | $2,714 | $334,700 | $148,900 | $185,800 |
| 2021 | $2,581 | $300,100 | $135,300 | $164,800 |
| 2020 | $2,540 | $291,000 | $132,500 | $158,500 |
| 2019 | $2,387 | $275,300 | $125,700 | $149,600 |
| 2018 | $2,398 | $264,600 | $114,200 | $150,400 |
| 2017 | $2,213 | $246,700 | $104,100 | $142,600 |
| 2016 | $2,166 | $238,800 | $104,100 | $134,700 |
| 2015 | $2,104 | $234,600 | $102,100 | $132,500 |
| 2014 | $1,996 | $227,600 | $99,000 | $128,600 |
Source: Public Records
Map
Nearby Homes