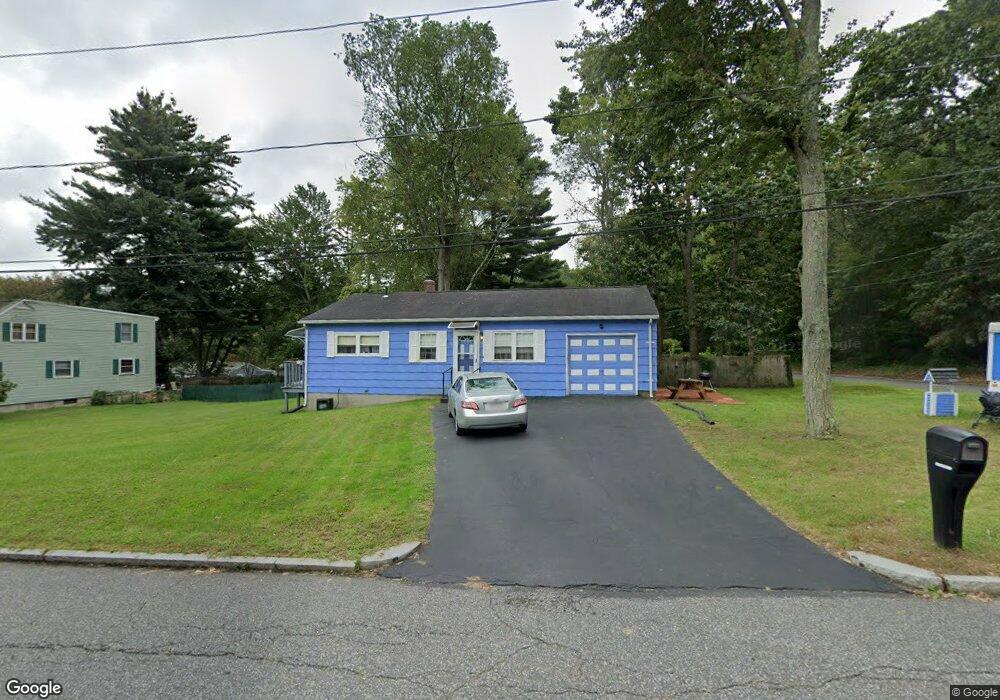
9 Shelby St Springfield, MA 01109
Pine Point NeighborhoodEstimated Value: $237,000 - $275,000
3
Beds
1
Bath
957
Sq Ft
$265/Sq Ft
Est. Value
About This Home
This home is located at 9 Shelby St, Springfield, MA 01109 and is currently estimated at $253,379, approximately $264 per square foot. 9 Shelby St is a home located in Hampden County with nearby schools including Thomas M Balliet Elementary School, John J Duggan Middle, and Roger L. Putnam Vocational Technical Academy.
Ownership History
Date
Name
Owned For
Owner Type
Purchase Details
Closed on
Sep 17, 2010
Sold by
Regnier Marshia and Regnier John Andrew
Bought by
Johnson Donald L
Current Estimated Value
Home Financials for this Owner
Home Financials are based on the most recent Mortgage that was taken out on this home.
Original Mortgage
$102,618
Outstanding Balance
$67,255
Interest Rate
4.37%
Mortgage Type
FHA
Estimated Equity
$186,124
Purchase Details
Closed on
Feb 15, 1991
Sold by
Grise Clarence A and Danziger Ronald H
Bought by
Regnier John A
Create a Home Valuation Report for This Property
The Home Valuation Report is an in-depth analysis detailing your home's value as well as a comparison with similar homes in the area
Home Values in the Area
Average Home Value in this Area
Purchase History
| Date | Buyer | Sale Price | Title Company |
|---|---|---|---|
| Johnson Donald L | $104,000 | -- | |
| Regnier John A | $51,000 | -- |
Source: Public Records
Mortgage History
| Date | Status | Borrower | Loan Amount |
|---|---|---|---|
| Open | Johnson Donald L | $102,618 |
Source: Public Records
Tax History
| Year | Tax Paid | Tax Assessment Tax Assessment Total Assessment is a certain percentage of the fair market value that is determined by local assessors to be the total taxable value of land and additions on the property. | Land | Improvement |
|---|---|---|---|---|
| 2025 | $3,606 | $230,000 | $41,100 | $188,900 |
| 2024 | $3,405 | $212,000 | $34,300 | $177,700 |
| 2023 | $2,900 | $170,100 | $31,200 | $138,900 |
| 2022 | $2,748 | $146,000 | $29,100 | $116,900 |
| 2021 | $2,500 | $132,300 | $26,500 | $105,800 |
| 2020 | $2,549 | $130,500 | $26,500 | $104,000 |
| 2019 | $2,322 | $118,000 | $26,500 | $91,500 |
| 2018 | $2,269 | $115,300 | $26,500 | $88,800 |
| 2017 | $2,245 | $114,200 | $24,500 | $89,700 |
| 2016 | $2,135 | $108,600 | $24,500 | $84,100 |
| 2015 | $2,000 | $101,700 | $24,500 | $77,200 |
Source: Public Records
Map
Nearby Homes
Your Personal Tour Guide
Ask me questions while you tour the home.