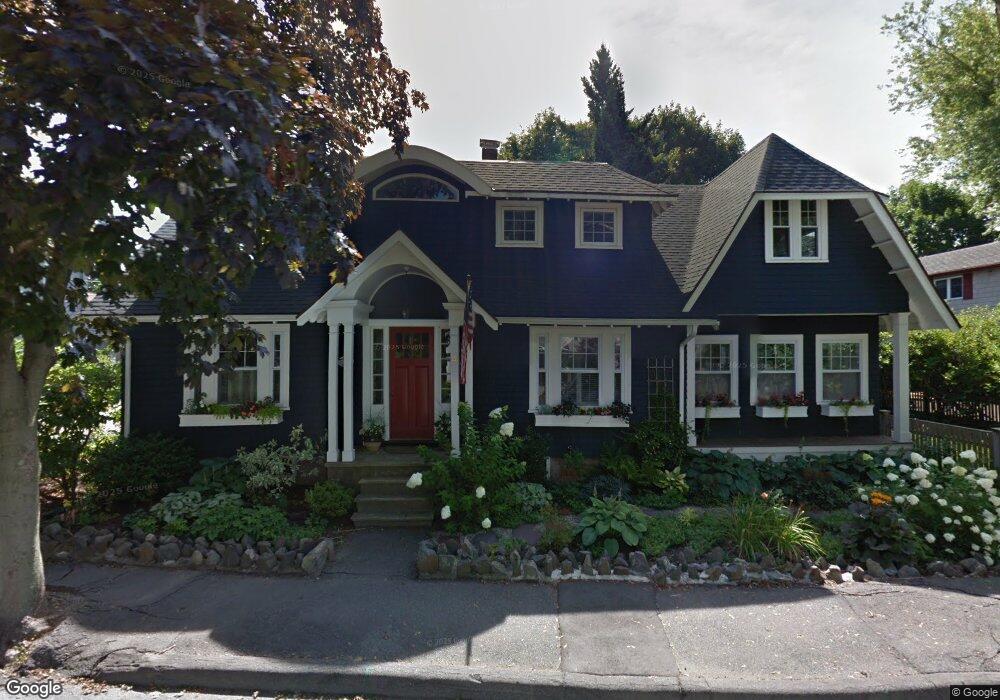
9 Shepard St Marblehead, MA 01945
Estimated Value: $1,000,000 - $1,315,000
3
Beds
2
Baths
1,964
Sq Ft
$584/Sq Ft
Est. Value
About This Home
This home is located at 9 Shepard St, Marblehead, MA 01945 and is currently estimated at $1,147,621, approximately $584 per square foot. 9 Shepard St is a home located in Essex County with nearby schools including Marblehead High School, Marblehead Community Charter Public School, and Tower School.
Ownership History
Date
Name
Owned For
Owner Type
Purchase Details
Closed on
Jun 10, 2005
Sold by
Hamilton Douglas W and Goodchild Paige W
Bought by
Contis James M and Tracey Lisa M
Current Estimated Value
Purchase Details
Closed on
Mar 29, 2002
Sold by
Smith Christopher R and Smith Claire S
Bought by
Hamilton Douglas W and Goodchild Paige W
Purchase Details
Closed on
Feb 29, 1996
Sold by
Hancke Jon and Hancke Susan
Bought by
Smith Christopher and Smith Claire
Create a Home Valuation Report for This Property
The Home Valuation Report is an in-depth analysis detailing your home's value as well as a comparison with similar homes in the area
Home Values in the Area
Average Home Value in this Area
Purchase History
| Date | Buyer | Sale Price | Title Company |
|---|---|---|---|
| Contis James M | $595,000 | -- | |
| Contis James M | $595,000 | -- | |
| Hamilton Douglas W | $470,000 | -- | |
| Smith Christopher | $243,000 | -- | |
| Smith Christopher | $243,000 | -- |
Source: Public Records
Mortgage History
| Date | Status | Borrower | Loan Amount |
|---|---|---|---|
| Open | Smith Christopher | $299,000 |
Source: Public Records
Tax History
| Year | Tax Paid | Tax Assessment Tax Assessment Total Assessment is a certain percentage of the fair market value that is determined by local assessors to be the total taxable value of land and additions on the property. | Land | Improvement |
|---|---|---|---|---|
| 2025 | $9,096 | $1,005,100 | $565,100 | $440,000 |
| 2024 | $8,707 | $971,800 | $540,000 | $431,800 |
| 2023 | $8,712 | $871,200 | $514,800 | $356,400 |
| 2022 | $8,061 | $766,300 | $420,700 | $345,600 |
| 2021 | $7,959 | $763,800 | $401,800 | $362,000 |
| 2020 | $7,562 | $727,800 | $401,800 | $326,000 |
| 2019 | $7,413 | $690,200 | $364,200 | $326,000 |
| 2018 | $7,328 | $665,000 | $339,000 | $326,000 |
| 2017 | $6,908 | $627,400 | $301,400 | $326,000 |
| 2016 | $6,824 | $614,800 | $288,800 | $326,000 |
| 2015 | $6,673 | $602,300 | $276,300 | $326,000 |
| 2014 | $6,164 | $555,800 | $238,600 | $317,200 |
Source: Public Records
Map
Nearby Homes
- 78 Bayview Rd
- 145 Evans Road Extension
- 197A W Shore Dr Unit A
- 63 Green St
- 27 Evans Rd
- 6 Mount Vernon St
- 9 Lincoln Park
- 1 Haley Rd
- 8 Linden St
- 72 Village St
- 13 Linden St Unit 2
- 2 Highland Terrace
- 27 Village St Unit 1
- 132 Elm St
- 132 Elm St Unit 132
- 16 Liberty Rd
- 157 Green St Unit 3
- 30 Haley Rd Unit 1
- 290 Washington St Unit A
- 69 Kenneth Rd
Your Personal Tour Guide
Ask me questions while you tour the home.