V
Seller's Agent in 2020
Vincenzo Pintone
Lyv Realty
(781) 572-5966
19 Total Sales
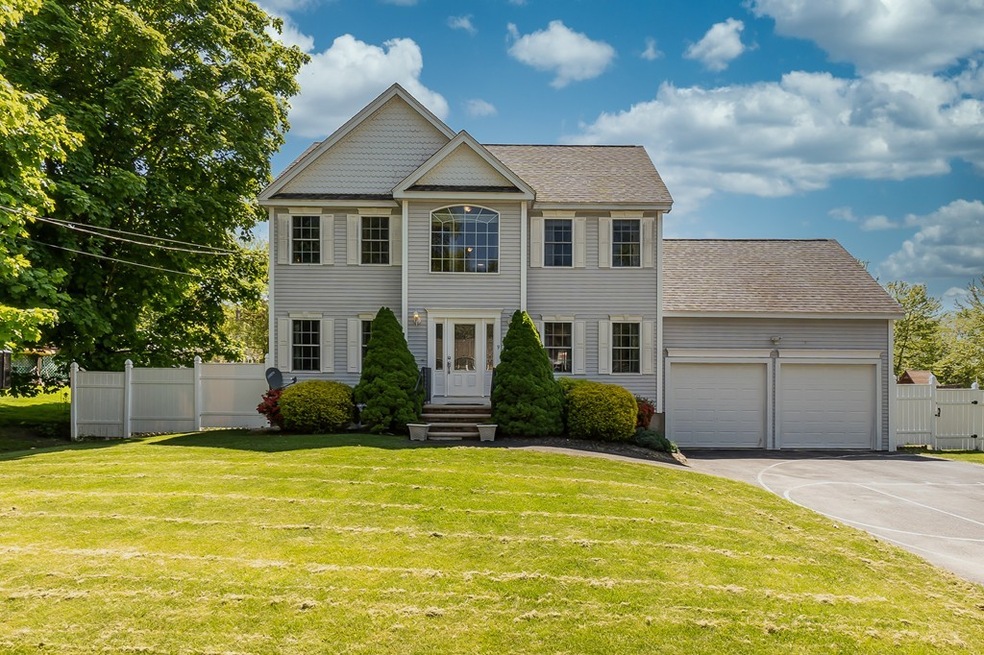
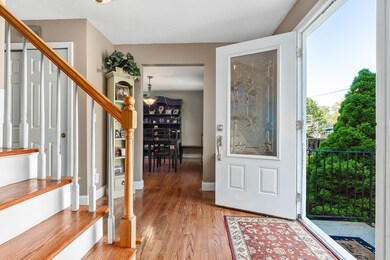
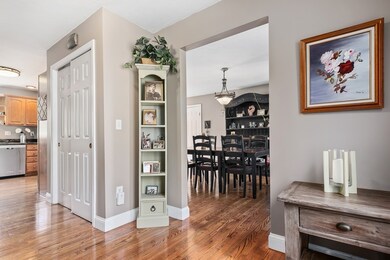
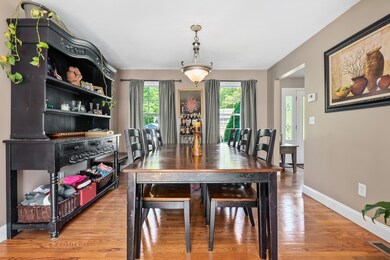
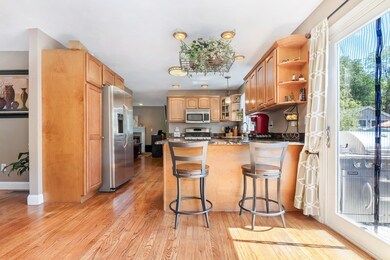
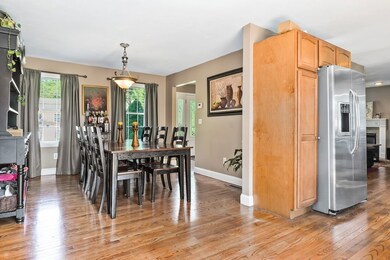
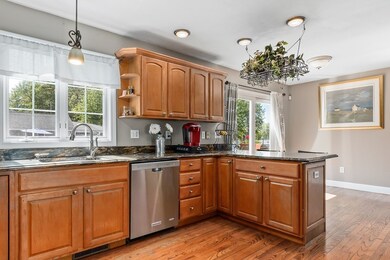
Don't miss this beautiful Colonial with a finished basement & lower level, plus a two car garage! This is a great home to entertain in all year long! Open concept first floor, formal dining room, kitchen features slider to deck and back yard, stainless appliances, light cherry cabinets, granite countertops & gas cooking. Updated half bath, laundry area & walk-in pantry closet located off of the kitchen. Living room includes gas fireplace & wired speaker system. On the second floor you'll find the master bedroom with vaulted ceilings & updated master bath & walk-in closet. Two additional bedrooms complete the second floor. Finished, walk-up third floor could be great space for fourth bedroom, playroom, office, or home theater. Enjoy a fully finished basement/game room, with half bath. Take in the views of Mascuppic Lake in your level, fenced-in yard with deck & patio. Plus a Full House Generator included as well!1ST SHOWINGS SAT 5/30 FROM 10AM-2PM BY APPOINTMENT ONLY.
| Date | Type | Sale Price | Title Company |
|---|---|---|---|
| Quit Claim Deed | -- | -- | |
| Quit Claim Deed | -- | -- | |
| Deed | $340,000 | -- | |
| Deed | -- | -- | |
| Deed | $97,500 | -- |
| Date | Status | Loan Amount | Loan Type |
|---|---|---|---|
| Previous Owner | $272,000 | Purchase Money Mortgage | |
| Previous Owner | $221,250 | Purchase Money Mortgage |
| Date | Event | Price | Change | Sq Ft Price |
|---|---|---|---|---|
| 08/05/2020 08/05/20 | Sold | $507,000 | -0.6% | $196 / Sq Ft |
| 06/24/2020 06/24/20 | Pending | -- | -- | -- |
| 06/17/2020 06/17/20 | Price Changed | $509,995 | -1.9% | $197 / Sq Ft |
| 05/27/2020 05/27/20 | For Sale | $519,995 | +30.0% | $201 / Sq Ft |
| 12/16/2016 12/16/16 | Sold | $399,900 | 0.0% | $185 / Sq Ft |
| 11/07/2016 11/07/16 | Pending | -- | -- | -- |
| 11/03/2016 11/03/16 | Price Changed | $399,900 | -2.3% | $185 / Sq Ft |
| 11/01/2016 11/01/16 | For Sale | $409,500 | 0.0% | $189 / Sq Ft |
| 10/24/2016 10/24/16 | Pending | -- | -- | -- |
| 10/19/2016 10/19/16 | Price Changed | $409,500 | -3.5% | $189 / Sq Ft |
| 10/13/2016 10/13/16 | Price Changed | $424,500 | -3.2% | $196 / Sq Ft |
| 10/08/2016 10/08/16 | For Sale | $438,500 | -- | $203 / Sq Ft |
| Year | Tax Paid | Tax Assessment Tax Assessment Total Assessment is a certain percentage of the fair market value that is determined by local assessors to be the total taxable value of land and additions on the property. | Land | Improvement |
|---|---|---|---|---|
| 2025 | $78 | $628,600 | $187,600 | $441,000 |
| 2024 | $7,701 | $605,400 | $177,500 | $427,900 |
| 2023 | $7,375 | $521,600 | $147,400 | $374,200 |
| 2022 | $7,159 | $479,200 | $128,900 | $350,300 |
| 2021 | $7,050 | $438,700 | $117,200 | $321,500 |
| 2020 | $6,729 | $414,100 | $110,500 | $303,600 |
| 2019 | $6,432 | $379,900 | $105,500 | $274,400 |
| 2018 | $6,339 | $370,500 | $105,500 | $265,000 |
| 2017 | $5,541 | $322,900 | $105,500 | $217,400 |
| 2016 | $5,416 | $308,400 | $105,500 | $202,900 |
| 2015 | $5,230 | $308,400 | $105,500 | $202,900 |
V
Seller's Agent in 2020
Vincenzo Pintone
Lyv Realty
(781) 572-5966
19 Total Sales

Buyer's Agent in 2020
Bridget Partridge
Coldwell Banker Realty - Westford
(978) 399-9475
47 Total Sales
Seller's Agent in 2016
Susan Lewis
Century 21 Your Way
(978) 618-2704
1 in this area
19 Total Sales
Buyer's Agent in 2016
Mark McGinn
McGinn & Associates Realty, LLC
(603) 479-6192
74 Total Sales
Source: MLS Property Information Network (MLS PIN)
MLS Number: 72662652
APN: TYNG-000031A-000090
Disclaimer: Certain information contained herein is derived from information provided by parties other than Homes.com. All information provided is deemed reliable, but is not guaranteed to be accurate and should be independently verified.
![]() The property listing data and information, or the Images, set forth herein were provided to MLS Property Information Network, Inc. from third party sources, including sellers, lessors and public records, and were compiled by MLS Property Information Network, Inc. The property listing data and information, and the Images, are for the personal, non-commercial use of consumers having a good faith interest in purchasing or leasing listed properties of the type displayed to them and may not be used for any purpose other than to identify prospective properties which such consumers may have a good faith interest in purchasing or leasing. MLS Property Information Network, Inc. and its subscribers disclaim any and all representations and warranties as to the accuracy of the property listing data and information, or as to the accuracy of any of the Images, set forth herein.
The property listing data and information, or the Images, set forth herein were provided to MLS Property Information Network, Inc. from third party sources, including sellers, lessors and public records, and were compiled by MLS Property Information Network, Inc. The property listing data and information, and the Images, are for the personal, non-commercial use of consumers having a good faith interest in purchasing or leasing listed properties of the type displayed to them and may not be used for any purpose other than to identify prospective properties which such consumers may have a good faith interest in purchasing or leasing. MLS Property Information Network, Inc. and its subscribers disclaim any and all representations and warranties as to the accuracy of the property listing data and information, or as to the accuracy of any of the Images, set forth herein.