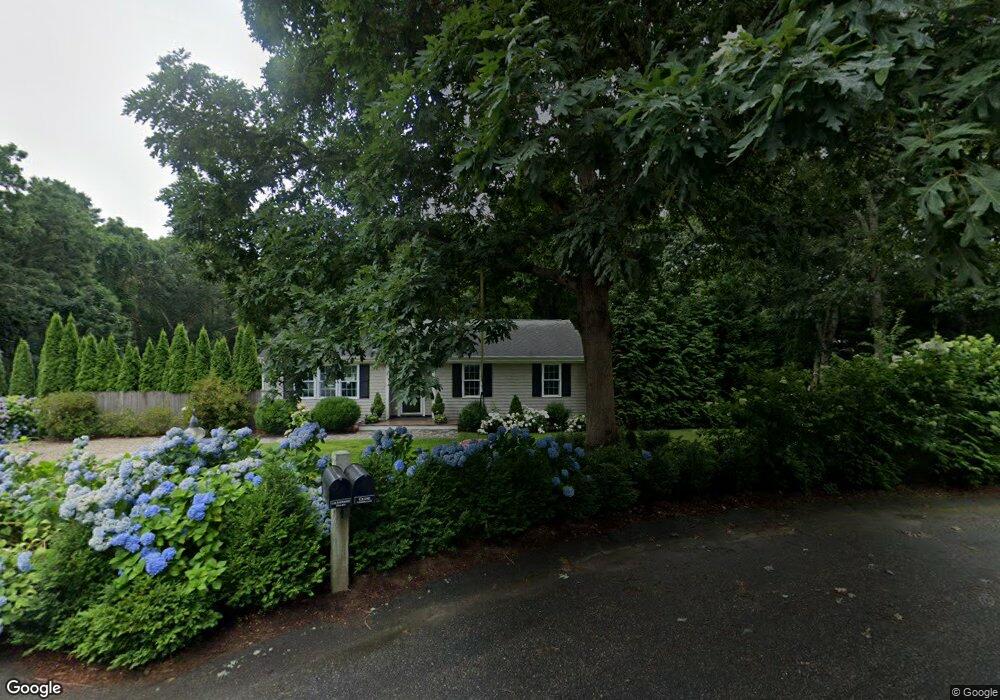
9 Sherry Ln Pocasset, MA 02559
Monument Beach NeighborhoodEstimated Value: $483,000 - $557,000
3
Beds
1
Bath
1,080
Sq Ft
$476/Sq Ft
Est. Value
About This Home
This home is located at 9 Sherry Ln, Pocasset, MA 02559 and is currently estimated at $514,238, approximately $476 per square foot. 9 Sherry Ln is a home located in Barnstable County with nearby schools including Bourne High School, St Margaret Regional School, and Cadence Academy Preschool - Bourne.
Ownership History
Date
Name
Owned For
Owner Type
Purchase Details
Closed on
Nov 26, 2010
Sold by
Crane Michael D
Bought by
D Crane Int M
Current Estimated Value
Purchase Details
Closed on
Jan 20, 2010
Sold by
Us Bk
Bought by
Crane Michael D
Purchase Details
Closed on
Oct 21, 2009
Sold by
Moore Robert J and Us Bk
Bought by
Us Bk
Purchase Details
Closed on
Jul 6, 2006
Sold by
Moore Edward
Bought by
Moore Robert J
Home Financials for this Owner
Home Financials are based on the most recent Mortgage that was taken out on this home.
Original Mortgage
$156,000
Interest Rate
6.6%
Mortgage Type
Purchase Money Mortgage
Create a Home Valuation Report for This Property
The Home Valuation Report is an in-depth analysis detailing your home's value as well as a comparison with similar homes in the area
Home Values in the Area
Average Home Value in this Area
Purchase History
| Date | Buyer | Sale Price | Title Company |
|---|---|---|---|
| D Crane Int M | -- | -- | |
| D Crane Int M | -- | -- | |
| Crane Michael D | $190,000 | -- | |
| Crane Michael D | $190,000 | -- | |
| Us Bk | $182,123 | -- | |
| Us Bk | $182,123 | -- | |
| Moore Robert J | $195,000 | -- | |
| Moore Robert J | $195,000 | -- |
Source: Public Records
Mortgage History
| Date | Status | Borrower | Loan Amount |
|---|---|---|---|
| Previous Owner | Moore Robert J | $156,000 | |
| Previous Owner | Moore Robert J | $47,000 |
Source: Public Records
Tax History Compared to Growth
Tax History
| Year | Tax Paid | Tax Assessment Tax Assessment Total Assessment is a certain percentage of the fair market value that is determined by local assessors to be the total taxable value of land and additions on the property. | Land | Improvement |
|---|---|---|---|---|
| 2025 | $3,205 | $410,400 | $202,000 | $208,400 |
| 2024 | $3,133 | $390,700 | $192,400 | $198,300 |
| 2023 | $3,047 | $345,900 | $170,300 | $175,600 |
| 2022 | $2,929 | $290,300 | $150,700 | $139,600 |
| 2021 | $2,845 | $264,200 | $137,100 | $127,100 |
| 2020 | $2,758 | $256,800 | $135,800 | $121,000 |
| 2019 | $2,628 | $250,000 | $135,800 | $114,200 |
| 2018 | $2,453 | $232,700 | $129,400 | $103,300 |
| 2017 | $2,321 | $225,300 | $121,700 | $103,600 |
| 2016 | $2,239 | $220,400 | $121,700 | $98,700 |
| 2015 | $2,091 | $207,600 | $108,900 | $98,700 |
Source: Public Records
Map
Nearby Homes
- 440 County Rd
- 18 Douglas Ave
- 566 Shore Rd
- 501 County Rd
- 515 County Rd
- 30 Howard Ave
- 18 Carlton Rd
- 105 Clay Pond Rd
- 93 Valley Bars Rd
- 39 Bennets Neck Dr
- 12 Beachwood Rd
- 18 Quaker Ln
- 203 County Rd
- 2 Westerly Dr
- 14 Navajo Rd
- 16 Amberwood Ct
- 34 Turnberry Rd
- 12 Turnberry Rd Unit 12
- 709 County Rd
- 174 Barlows Landing Rd