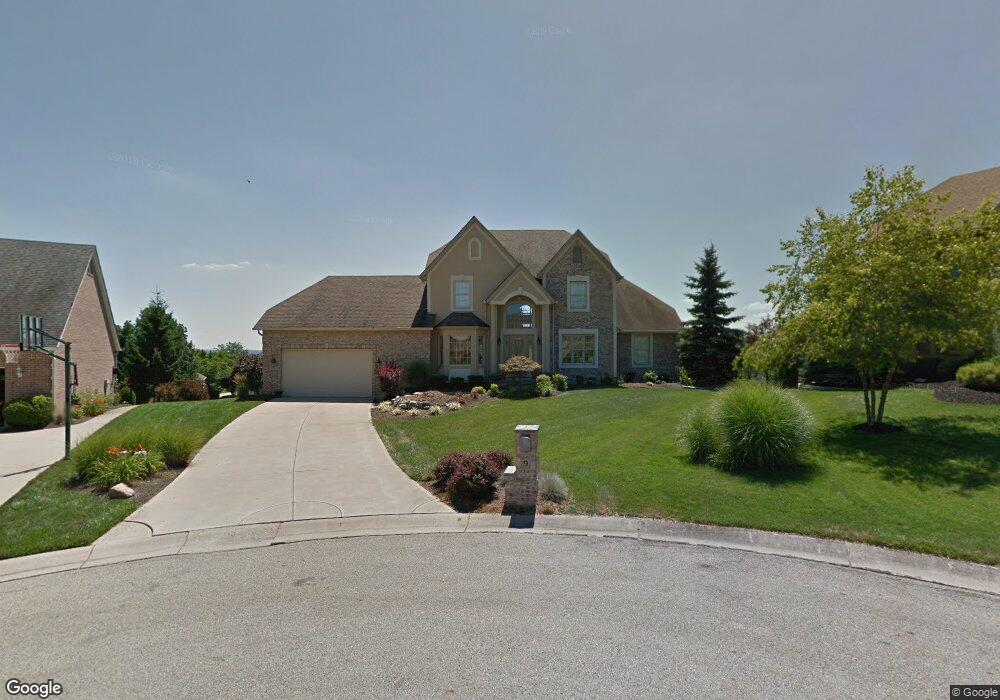
9 Sheryl Ct Hamilton, OH 45013
Estimated Value: $434,000 - $483,000
4
Beds
3
Baths
2,634
Sq Ft
$172/Sq Ft
Est. Value
About This Home
This home is located at 9 Sheryl Ct, Hamilton, OH 45013 and is currently estimated at $453,608, approximately $172 per square foot. 9 Sheryl Ct is a home located in Butler County with nearby schools including Bridgeport Elementary School, Wilson Middle School, and Hamilton Freshman School.
Ownership History
Date
Name
Owned For
Owner Type
Purchase Details
Closed on
Jan 19, 2000
Sold by
Shelton Martin E
Bought by
Ruecking Daniel J and Ruecking Susan R
Current Estimated Value
Home Financials for this Owner
Home Financials are based on the most recent Mortgage that was taken out on this home.
Original Mortgage
$175,000
Outstanding Balance
$52,880
Interest Rate
7.84%
Mortgage Type
Purchase Money Mortgage
Estimated Equity
$400,728
Purchase Details
Closed on
Nov 4, 1999
Sold by
Shelton & Development Inc
Bought by
Shelton Martin E
Create a Home Valuation Report for This Property
The Home Valuation Report is an in-depth analysis detailing your home's value as well as a comparison with similar homes in the area
Home Values in the Area
Average Home Value in this Area
Purchase History
| Date | Buyer | Sale Price | Title Company |
|---|---|---|---|
| Ruecking Daniel J | $226,975 | Superior Title Agency Inc | |
| Shelton Martin E | $30,000 | -- |
Source: Public Records
Mortgage History
| Date | Status | Borrower | Loan Amount |
|---|---|---|---|
| Open | Ruecking Daniel J | $175,000 |
Source: Public Records
Tax History
| Year | Tax Paid | Tax Assessment Tax Assessment Total Assessment is a certain percentage of the fair market value that is determined by local assessors to be the total taxable value of land and additions on the property. | Land | Improvement |
|---|---|---|---|---|
| 2025 | $5,220 | $120,510 | $15,980 | $104,530 |
| 2024 | $5,220 | $120,510 | $15,980 | $104,530 |
| 2023 | $5,196 | $120,510 | $15,980 | $104,530 |
| 2022 | $4,544 | $88,740 | $15,980 | $72,760 |
| 2021 | $3,982 | $85,670 | $15,980 | $69,690 |
| 2020 | $4,149 | $85,670 | $15,980 | $69,690 |
| 2019 | $5,431 | $74,180 | $15,950 | $58,230 |
| 2018 | $3,547 | $74,180 | $15,950 | $58,230 |
| 2017 | $3,577 | $74,180 | $15,950 | $58,230 |
| 2016 | $3,725 | $73,630 | $15,950 | $57,680 |
| 2015 | $3,705 | $73,630 | $15,950 | $57,680 |
| 2014 | $3,590 | $73,630 | $15,950 | $57,680 |
| 2013 | $3,590 | $75,950 | $15,950 | $60,000 |
Source: Public Records
Map
Nearby Homes
- 1754 Thall Dr
- 1683 Thall Dr
- 548 Shultz Dr
- 1653 Chippewa Dr
- 1420 Alexander Dr
- 124 Gregory Ln
- 1101 Cleveland Ave
- 44 Martin Ave
- 492 Seven Mile Ave
- 0 Hamilton Eaton Rd
- 0 Hamilton Eaton Rd Unit 1830987
- 1319 Peregrine Way
- 277 Howman Ave
- 273 Howman Ave
- 1331 Peregrine Way
- 839 Willow Ave
- 850 NW Washington Blvd
- 22 Hughes Ct
- 228 Morris Ave
- 3883 Piper Ln
Your Personal Tour Guide
Ask me questions while you tour the home.