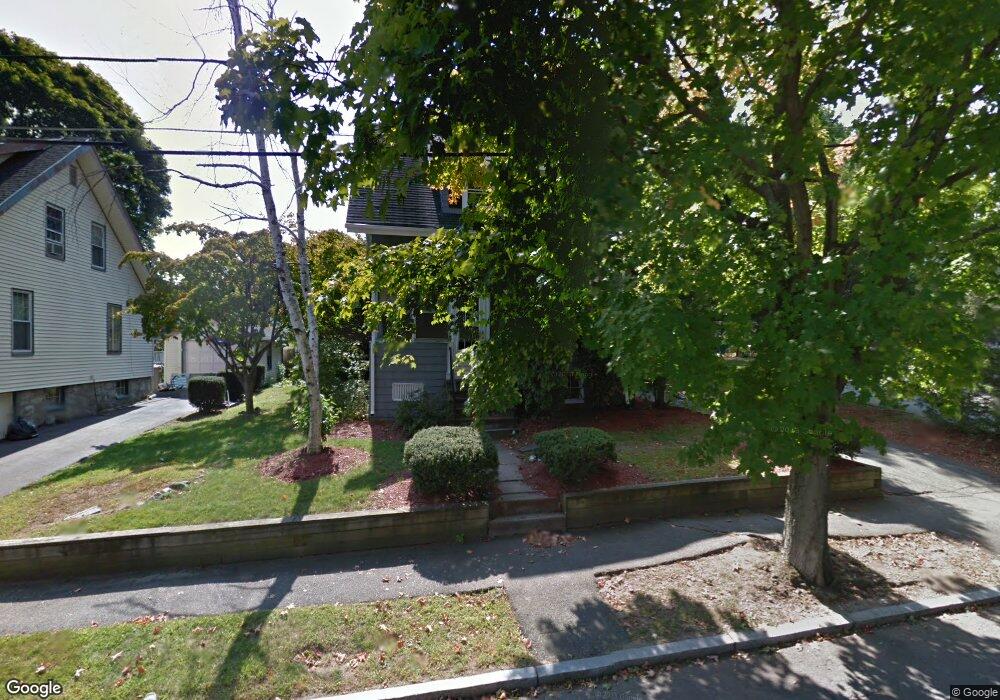
9 Simonds Rd Melrose, MA 02176
Mount Hood NeighborhoodEstimated Value: $668,000 - $853,000
3
Beds
1
Bath
934
Sq Ft
$783/Sq Ft
Est. Value
About This Home
This home is located at 9 Simonds Rd, Melrose, MA 02176 and is currently estimated at $731,070, approximately $782 per square foot. 9 Simonds Rd is a home located in Middlesex County with nearby schools including Winthrop Elementary School, Horace Mann Elementary School, and Hoover Elementary School.
Ownership History
Date
Name
Owned For
Owner Type
Purchase Details
Closed on
Aug 1, 1997
Sold by
Wadland Lawrence A and Wadland Caroline
Bought by
Spies Diane M
Current Estimated Value
Home Financials for this Owner
Home Financials are based on the most recent Mortgage that was taken out on this home.
Original Mortgage
$100,000
Interest Rate
7.55%
Mortgage Type
Purchase Money Mortgage
Create a Home Valuation Report for This Property
The Home Valuation Report is an in-depth analysis detailing your home's value as well as a comparison with similar homes in the area
Home Values in the Area
Average Home Value in this Area
Purchase History
| Date | Buyer | Sale Price | Title Company |
|---|---|---|---|
| Spies Diane M | $148,000 | -- |
Source: Public Records
Mortgage History
| Date | Status | Borrower | Loan Amount |
|---|---|---|---|
| Open | Spies Diane M | $170,000 | |
| Closed | Spies Diane M | $100,000 | |
| Previous Owner | Spies Diane M | $40,000 |
Source: Public Records
Tax History
| Year | Tax Paid | Tax Assessment Tax Assessment Total Assessment is a certain percentage of the fair market value that is determined by local assessors to be the total taxable value of land and additions on the property. | Land | Improvement |
|---|---|---|---|---|
| 2025 | $60 | $609,300 | $443,400 | $165,900 |
| 2024 | $5,748 | $578,900 | $416,500 | $162,400 |
| 2023 | $5,794 | $556,000 | $403,100 | $152,900 |
| 2022 | $5,821 | $550,700 | $403,100 | $147,600 |
| 2021 | $5,624 | $513,600 | $376,200 | $137,400 |
| 2020 | $5,231 | $473,400 | $335,900 | $137,500 |
| 2019 | $4,728 | $437,400 | $310,400 | $127,000 |
| 2018 | $4,636 | $409,200 | $282,200 | $127,000 |
| 2017 | $4,535 | $384,300 | $268,700 | $115,600 |
| 2016 | $4,483 | $363,600 | $262,000 | $101,600 |
| 2015 | $4,296 | $331,500 | $235,100 | $96,400 |
| 2014 | $4,046 | $304,700 | $208,300 | $96,400 |
Source: Public Records
Map
Nearby Homes
- 187 Laurel St
- 311 Beech Ave
- 30 Wheeler Ave
- 1 Mill Rd
- 12B Cheever Ave
- 12C Cheever Ave
- 7 Birch Hill Rd
- 71-73 Grove St
- 7 Blacksmith Way
- 48 Malvern St Unit 2
- 65 Beacon St
- 15 Cass St
- 22 E Emerson St
- 8 Crystal St Unit 2
- 8 Crystal St Unit 3
- 86 Lynn Fells Pkwy
- 31 Temple St
- 236-238 Main St
- 13 Linwood Ave Unit 13
- 534 Main St Unit 11
Your Personal Tour Guide
Ask me questions while you tour the home.