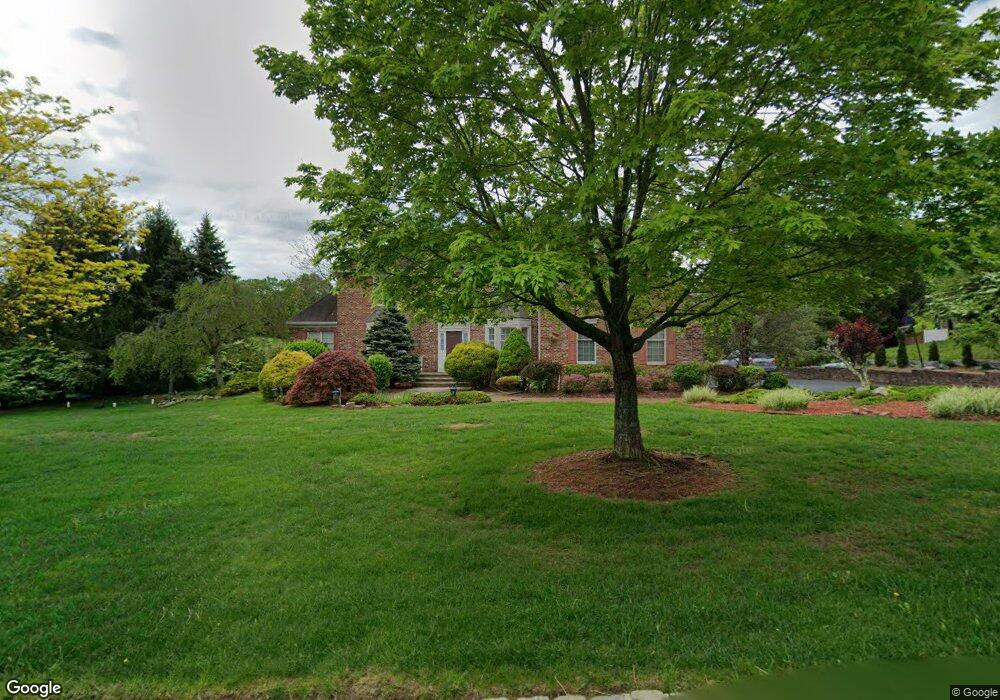
9 Skyview Dr Sparta, NJ 07871
Estimated Value: $985,955 - $1,151,000
Studio
--
Bath
4,452
Sq Ft
$239/Sq Ft
Est. Value
About This Home
This home is located at 9 Skyview Dr, Sparta, NJ 07871 and is currently estimated at $1,065,239, approximately $239 per square foot. 9 Skyview Dr is a home located in Sussex County with nearby schools including Sparta High School, Alpine Montessori - Sparta, and Reverand George A. Brown School.
Ownership History
Date
Name
Owned For
Owner Type
Purchase Details
Closed on
Mar 31, 2020
Sold by
J & B Windsor Lake Estates Llc
Bought by
Sparta Holding Company Llc
Current Estimated Value
Purchase Details
Closed on
Jan 26, 2004
Sold by
Quinones Dan and Quinones Hilda
Bought by
Ramirez Freddy O and Ramirez Silvia A
Home Financials for this Owner
Home Financials are based on the most recent Mortgage that was taken out on this home.
Original Mortgage
$322,700
Interest Rate
4.75%
Mortgage Type
Stand Alone First
Purchase Details
Closed on
Sep 29, 1999
Sold by
Skyview Homes Llc
Bought by
Quinones Dan and Quinones Hilda
Home Financials for this Owner
Home Financials are based on the most recent Mortgage that was taken out on this home.
Original Mortgage
$473,400
Interest Rate
7.85%
Mortgage Type
Stand Alone First
Create a Home Valuation Report for This Property
The Home Valuation Report is an in-depth analysis detailing your home's value as well as a comparison with similar homes in the area
Home Values in the Area
Average Home Value in this Area
Purchase History
| Date | Buyer | Sale Price | Title Company |
|---|---|---|---|
| Sparta Holding Company Llc | -- | None Available | |
| Ramirez Freddy O | $709,500 | -- | |
| Quinones Dan | $571,440 | -- | |
| Skyview Homes Llc | -- | -- |
Source: Public Records
Mortgage History
| Date | Status | Borrower | Loan Amount |
|---|---|---|---|
| Previous Owner | Ramirez Freddy O | $322,700 | |
| Previous Owner | Quinones Dan | $473,400 |
Source: Public Records
Tax History
| Year | Tax Paid | Tax Assessment Tax Assessment Total Assessment is a certain percentage of the fair market value that is determined by local assessors to be the total taxable value of land and additions on the property. | Land | Improvement |
|---|---|---|---|---|
| 2025 | $22,313 | $621,700 | $186,300 | $435,400 |
| 2024 | $21,672 | $621,700 | $186,300 | $435,400 |
| 2023 | $21,672 | $621,700 | $186,300 | $435,400 |
| 2022 | $21,150 | $621,700 | $186,300 | $435,400 |
| 2021 | $20,815 | $621,700 | $186,300 | $435,400 |
| 2020 | $21,138 | $621,700 | $186,300 | $435,400 |
| 2019 | $20,591 | $621,700 | $186,300 | $435,400 |
| 2018 | $20,156 | $621,700 | $186,300 | $435,400 |
| 2017 | $19,907 | $621,700 | $186,300 | $435,400 |
| 2016 | $19,441 | $621,700 | $186,300 | $435,400 |
| 2015 | $19,939 | $512,700 | $131,100 | $381,600 |
| 2014 | $19,616 | $512,700 | $131,100 | $381,600 |
Source: Public Records
Map
Nearby Homes
- 107 Lambert Dr
- 99 Lambert Dr
- 36 Bridle Way Unit 236
- 466 Sparta Ave
- 15 Mountain Spring Dr
- 21 Starrett Ct
- 16 Main St
- 16 Main St Unit D6
- 7 Celia Dr
- 118 Main St
- 4 Arrowhead Trail
- 236 Sparta Ave
- 309 Houses Corner Rd
- 2 Bell St
- 460 Lafayette Rd
- 34 N Shore Trail
- 190 W Shore Trail
- 66 Mara Blvd
- 18 Sagamore Trail
- 25 Graphic Blvd
Your Personal Tour Guide
Ask me questions while you tour the home.