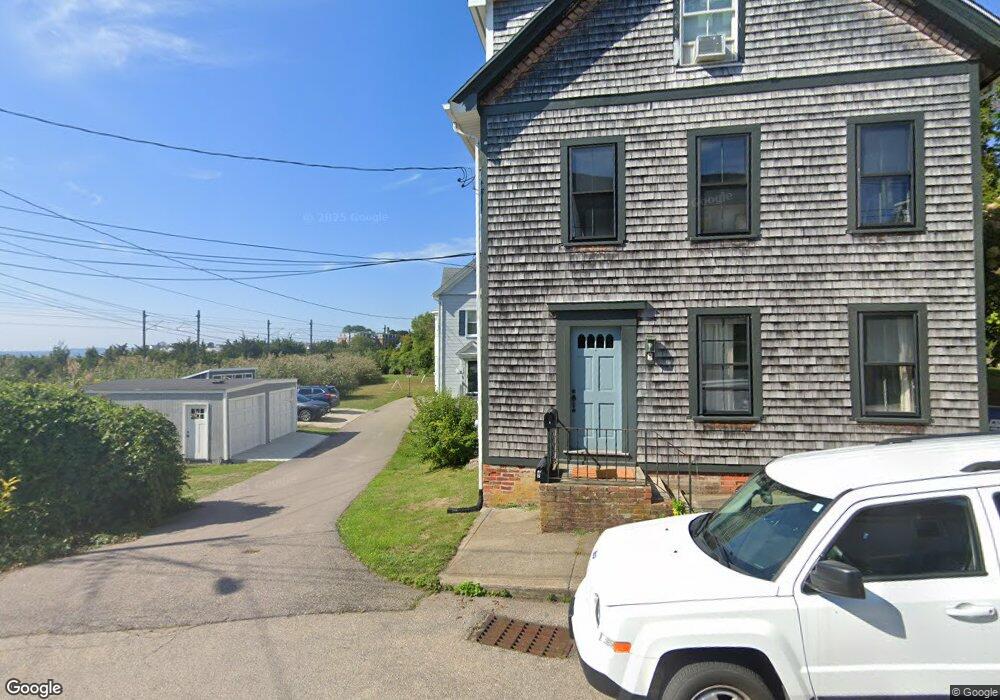
9 South St Unit 3 Stonington, CT 06378
Estimated Value: $587,000 - $748,000
1
Bed
1
Bath
2,295
Sq Ft
$285/Sq Ft
Est. Value
About This Home
This home is located at 9 South St Unit 3, Stonington, CT 06378 and is currently estimated at $654,879, approximately $285 per square foot. 9 South St Unit 3 is a home located in New London County with nearby schools including Stonington Middle School, Stonington High School, and Pine Point School.
Ownership History
Date
Name
Owned For
Owner Type
Purchase Details
Closed on
Jun 6, 2025
Sold by
Kindelan Karen S and Kindelan John F
Bought by
Kindelan John and Kindelan Alaina
Current Estimated Value
Purchase Details
Closed on
May 29, 2013
Sold by
Fnma
Bought by
Nancy A Bestwick Ira and Equity T Co
Purchase Details
Closed on
Aug 24, 2011
Sold by
Bac Home Loans Svcng L
Bought by
Federal National Mortgage Association
Purchase Details
Closed on
Sep 3, 1993
Sold by
Pollard Jane M
Bought by
Macione Michael D and Macione Catherine M
Home Financials for this Owner
Home Financials are based on the most recent Mortgage that was taken out on this home.
Original Mortgage
$68,000
Interest Rate
7.11%
Mortgage Type
Purchase Money Mortgage
Create a Home Valuation Report for This Property
The Home Valuation Report is an in-depth analysis detailing your home's value as well as a comparison with similar homes in the area
Home Values in the Area
Average Home Value in this Area
Purchase History
| Date | Buyer | Sale Price | Title Company |
|---|---|---|---|
| Kindelan John | -- | None Available | |
| Kindelan John | -- | None Available | |
| Nancy A Bestwick Ira | $297,100 | -- | |
| Ira Nancy A Bestwick | $297,100 | -- | |
| Federal National Mortgage Association | -- | -- | |
| Federal National Mortgage Association | -- | -- | |
| Macione Michael D | $85,000 | -- | |
| Macione Michael D | $85,000 | -- |
Source: Public Records
Mortgage History
| Date | Status | Borrower | Loan Amount |
|---|---|---|---|
| Previous Owner | Macione Michael D | $180,000 | |
| Previous Owner | Macione Michael D | $147,000 | |
| Previous Owner | Macione Michael D | $68,000 |
Source: Public Records
Tax History Compared to Growth
Tax History
| Year | Tax Paid | Tax Assessment Tax Assessment Total Assessment is a certain percentage of the fair market value that is determined by local assessors to be the total taxable value of land and additions on the property. | Land | Improvement |
|---|---|---|---|---|
| 2025 | $5,942 | $292,100 | $185,600 | $106,500 |
| 2024 | $5,696 | $292,100 | $185,600 | $106,500 |
| 2023 | $5,740 | $292,100 | $185,600 | $106,500 |
| 2022 | $6,212 | $233,000 | $152,000 | $81,000 |
| 2021 | $6,256 | $233,000 | $152,000 | $81,000 |
| 2020 | $6,142 | $233,000 | $152,000 | $81,000 |
| 2019 | $6,142 | $233,000 | $152,000 | $81,000 |
| 2018 | $5,960 | $233,000 | $152,000 | $81,000 |
| 2017 | $5,848 | $226,400 | $152,000 | $74,400 |
| 2016 | $5,685 | $226,400 | $152,000 | $74,400 |
| 2015 | $5,438 | $226,400 | $152,000 | $74,400 |
| 2014 | $5,191 | $226,400 | $152,000 | $74,400 |
Source: Public Records
Map
Nearby Homes
- 43 Broad St
- 103 Main St Unit 1103
- 32 Broadway Ave
- 259 N Main St
- 8 Richmond Ln
- 1 Harmony St
- 92 Water St
- 88 Water St
- 11 Main St
- 4 Northwest St Unit 34
- 218 N Water St
- 20 Omega St
- 12 Water St
- 45 Quanaduck Rd
- 4 Quanaduck Cove Ct
- 2 Coveside Ln Unit 2
- 258 Palmer Neck Rd
- 12 North St
- 455 Stonington Rd
- 71 Wolcott Ave