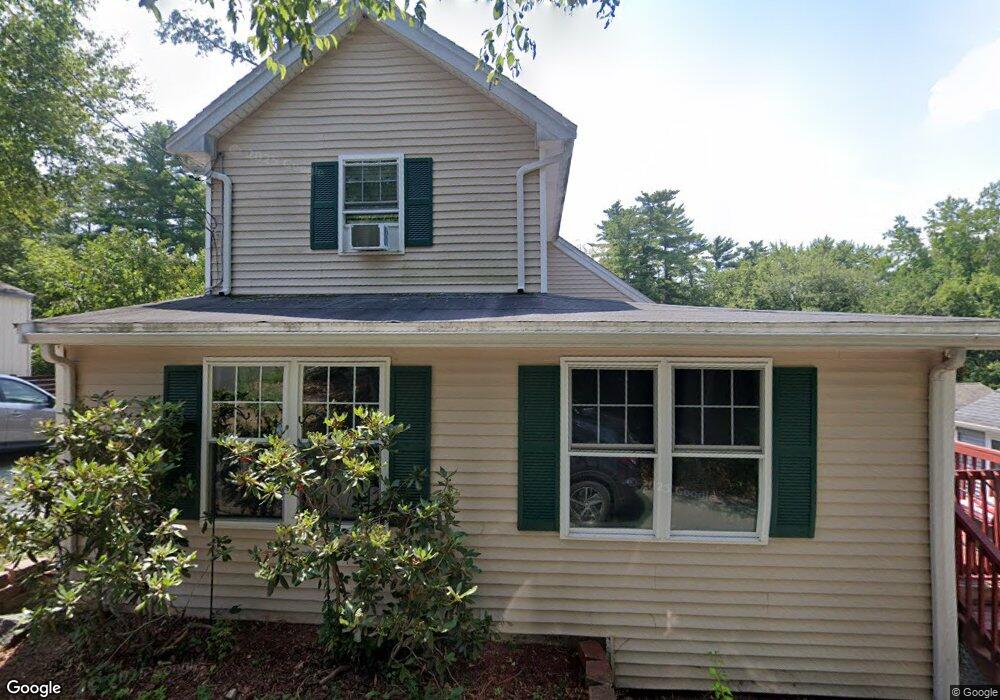
9 South St Wenham, MA 01984
Estimated Value: $606,310 - $675,000
2
Beds
2
Baths
1,379
Sq Ft
$467/Sq Ft
Est. Value
About This Home
This home is located at 9 South St, Wenham, MA 01984 and is currently estimated at $643,828, approximately $466 per square foot. 9 South St is a home located in Essex County with nearby schools including Winthrop School, Cutler Elementary School, and Miles River Middle School.
Ownership History
Date
Name
Owned For
Owner Type
Purchase Details
Closed on
Apr 10, 2009
Sold by
Skomurski Joseph A and Skomurski Joan M
Bought by
Pesente Christina and Roland Royal
Current Estimated Value
Home Financials for this Owner
Home Financials are based on the most recent Mortgage that was taken out on this home.
Original Mortgage
$265,109
Interest Rate
4.94%
Mortgage Type
Purchase Money Mortgage
Purchase Details
Closed on
Nov 21, 2008
Sold by
Price Joanne G and Price Michael L
Bought by
Skomurski Joseph A and Skomurski Joan M
Create a Home Valuation Report for This Property
The Home Valuation Report is an in-depth analysis detailing your home's value as well as a comparison with similar homes in the area
Home Values in the Area
Average Home Value in this Area
Purchase History
| Date | Buyer | Sale Price | Title Company |
|---|---|---|---|
| Pesente Christina | $270,000 | -- | |
| Pesente Christina | $270,000 | -- | |
| Skomurski Joseph A | $120,000 | -- | |
| Price Michael L | -- | -- | |
| Skomurski Joseph A | $120,000 | -- |
Source: Public Records
Mortgage History
| Date | Status | Borrower | Loan Amount |
|---|---|---|---|
| Open | Skomurski Joseph A | $264,794 | |
| Closed | Skomurski Joseph A | $265,109 |
Source: Public Records
Tax History Compared to Growth
Tax History
| Year | Tax Paid | Tax Assessment Tax Assessment Total Assessment is a certain percentage of the fair market value that is determined by local assessors to be the total taxable value of land and additions on the property. | Land | Improvement |
|---|---|---|---|---|
| 2025 | $7,869 | $506,400 | $263,500 | $242,900 |
| 2024 | $7,694 | $491,300 | $263,500 | $227,800 |
| 2023 | $5,691 | $328,000 | $168,700 | $159,300 |
| 2022 | $6,223 | $317,800 | $168,700 | $149,100 |
| 2021 | $6,006 | $305,200 | $156,100 | $149,100 |
| 2020 | $5,690 | $300,400 | $154,400 | $146,000 |
| 2019 | $5,413 | $300,400 | $154,400 | $146,000 |
| 2018 | $4,810 | $256,000 | $139,400 | $116,600 |
| 2017 | $4,692 | $256,000 | $139,400 | $116,600 |
| 2016 | $4,347 | $256,000 | $139,400 | $116,600 |
| 2015 | $4,160 | $256,000 | $139,400 | $116,600 |
Source: Public Records
Map
Nearby Homes
- 4 Longfellow Rd
- 105 Pleasant St
- 5 South St
- 8 South St
- 101 Pleasant St
- 101 Pleasant St
- 2 Longfellow Rd
- 6 Longfellow Rd
- 3 South St
- 3 Longfellow Rd
- 103 Pleasant St
- 7 Longfellow Rd
- 6 South St
- 1 & 2 Longfellow Rd
- 107 Pleasant St
- 109 Pleasant St
- 10 Longfellow Rd
- 113 Pleasant St
- 9 Batchelder Park
- 11 Batchelder Park