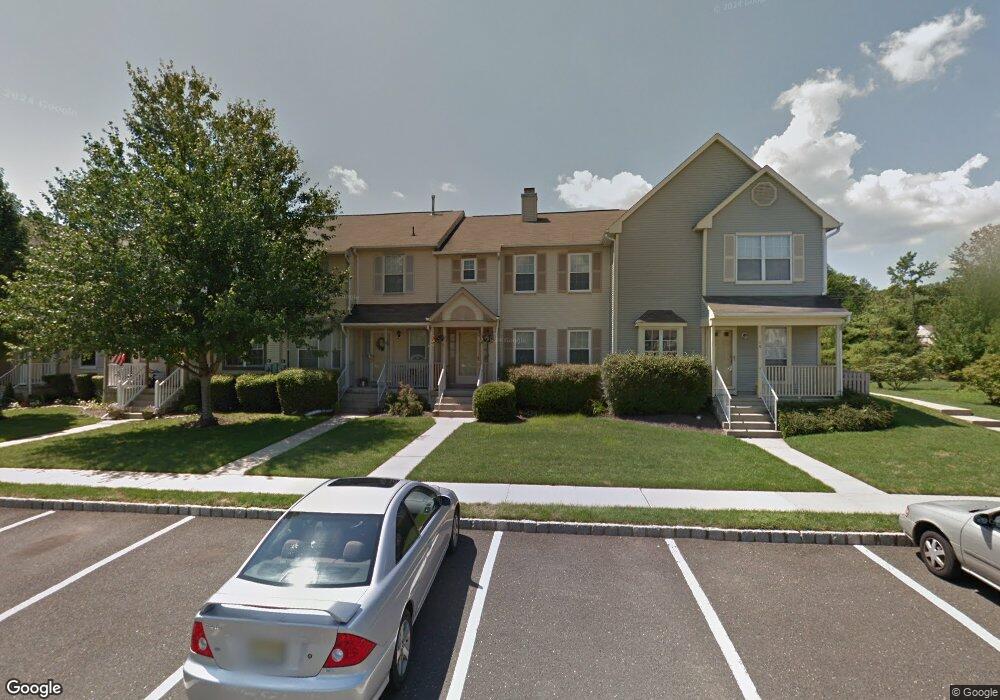
9 Stanwyck Ct Trenton, NJ 08691
Estimated Value: $495,000 - $565,000
--
Bed
--
Bath
1,372
Sq Ft
$382/Sq Ft
Est. Value
About This Home
This home is located at 9 Stanwyck Ct, Trenton, NJ 08691 and is currently estimated at $524,660, approximately $382 per square foot. 9 Stanwyck Ct is a home located in Mercer County with nearby schools including Sharon Elementary School, Pond Road Middle School, and Robbinsville High School.
Ownership History
Date
Name
Owned For
Owner Type
Purchase Details
Closed on
Nov 22, 2010
Sold by
Butler Silvia Sandra and Butler Donnell J
Bought by
Butler Sylvia Sandra
Current Estimated Value
Home Financials for this Owner
Home Financials are based on the most recent Mortgage that was taken out on this home.
Original Mortgage
$114,177
Outstanding Balance
$39,246
Interest Rate
4.23%
Mortgage Type
New Conventional
Estimated Equity
$485,414
Purchase Details
Closed on
Nov 18, 2002
Sold by
Ibach Kenneth
Bought by
Levin Sylvia
Home Financials for this Owner
Home Financials are based on the most recent Mortgage that was taken out on this home.
Original Mortgage
$130,000
Interest Rate
6.17%
Mortgage Type
Purchase Money Mortgage
Purchase Details
Closed on
Jan 14, 1993
Sold by
Carteret Realty Corp
Bought by
Ibach Kenneth J and Ibach Carol D
Create a Home Valuation Report for This Property
The Home Valuation Report is an in-depth analysis detailing your home's value as well as a comparison with similar homes in the area
Home Values in the Area
Average Home Value in this Area
Purchase History
| Date | Buyer | Sale Price | Title Company |
|---|---|---|---|
| Butler Sylvia Sandra | -- | Signature Title Agency Llc | |
| Levin Sylvia | $181,000 | -- | |
| Ibach Kenneth J | $124,500 | -- |
Source: Public Records
Mortgage History
| Date | Status | Borrower | Loan Amount |
|---|---|---|---|
| Open | Butler Sylvia Sandra | $114,177 | |
| Closed | Levin Sylvia | $130,000 |
Source: Public Records
Tax History Compared to Growth
Tax History
| Year | Tax Paid | Tax Assessment Tax Assessment Total Assessment is a certain percentage of the fair market value that is determined by local assessors to be the total taxable value of land and additions on the property. | Land | Improvement |
|---|---|---|---|---|
| 2025 | $9,167 | $274,300 | $143,200 | $131,100 |
| 2024 | $8,555 | $274,300 | $143,200 | $131,100 |
| 2023 | $8,555 | $274,300 | $143,200 | $131,100 |
| 2022 | $8,224 | $274,300 | $143,200 | $131,100 |
| 2021 | $8,106 | $274,300 | $143,200 | $131,100 |
| 2020 | $8,108 | $274,300 | $143,200 | $131,100 |
| 2019 | $8,111 | $274,300 | $143,200 | $131,100 |
| 2018 | $8,059 | $274,300 | $143,200 | $131,100 |
| 2017 | $8,042 | $274,300 | $143,200 | $131,100 |
| 2016 | $7,968 | $274,300 | $143,200 | $131,100 |
| 2015 | $7,848 | $274,300 | $143,200 | $131,100 |
| 2014 | $7,875 | $274,300 | $143,200 | $131,100 |
Source: Public Records
Map
Nearby Homes