Estimated Value: $445,000 - $484,000
2
Beds
2
Baths
912
Sq Ft
$506/Sq Ft
Est. Value
About This Home
This home is located at 9 Stoneridge Ln Unit 20, York, ME 03909 and is currently estimated at $461,590, approximately $506 per square foot. 9 Stoneridge Ln Unit 20 is a home located in York County with nearby schools including Coastal Ridge Elementary School, Village Elementary School, and York Middle School.
Ownership History
Date
Name
Owned For
Owner Type
Purchase Details
Closed on
Oct 7, 2022
Sold by
Walsh Edward T and Walsh Carol B
Bought by
E T & C Walsh Ret 2022 and Walsh
Current Estimated Value
Purchase Details
Closed on
Sep 21, 2018
Sold by
Frissell Ret and Frissell
Bought by
Walsh Edward and Walsh Carol
Purchase Details
Closed on
Jan 15, 2015
Sold by
Frissell Sally
Bought by
Frissell Ret and Frissell
Purchase Details
Closed on
Mar 18, 2011
Sold by
Knight Lisa G and Knight 3Rd Joseph F
Bought by
Frissell Sally
Home Financials for this Owner
Home Financials are based on the most recent Mortgage that was taken out on this home.
Original Mortgage
$120,000
Interest Rate
4.84%
Mortgage Type
Unknown
Create a Home Valuation Report for This Property
The Home Valuation Report is an in-depth analysis detailing your home's value as well as a comparison with similar homes in the area
Home Values in the Area
Average Home Value in this Area
Purchase History
| Date | Buyer | Sale Price | Title Company |
|---|---|---|---|
| E T & C Walsh Ret 2022 | -- | None Available | |
| E T & C Walsh Ret 2022 | -- | None Available | |
| E T & C Walsh Ret 2022 | -- | None Available | |
| Walsh Edward | -- | -- | |
| Walsh Edward | -- | -- | |
| Walsh Edward | -- | -- | |
| Frissell Ret | -- | -- | |
| Frissell Ret | -- | -- | |
| Frissell Sally | -- | -- | |
| Frissell Sally | -- | -- | |
| Frissell Sally | -- | -- |
Source: Public Records
Mortgage History
| Date | Status | Borrower | Loan Amount |
|---|---|---|---|
| Previous Owner | Frissell Sally | $120,000 |
Source: Public Records
Tax History Compared to Growth
Tax History
| Year | Tax Paid | Tax Assessment Tax Assessment Total Assessment is a certain percentage of the fair market value that is determined by local assessors to be the total taxable value of land and additions on the property. | Land | Improvement |
|---|---|---|---|---|
| 2024 | $3,132 | $372,900 | $237,600 | $135,300 |
| 2023 | $2,854 | $337,800 | $202,500 | $135,300 |
| 2022 | $2,792 | $326,500 | $24,400 | $302,100 |
| 2021 | $2,887 | $290,200 | $15,600 | $274,600 |
| 2020 | $2,734 | $246,300 | $15,600 | $230,700 |
| 2019 | $2,743 | $246,000 | $15,300 | $230,700 |
| 2018 | $1,212 | $215,400 | $12,800 | $202,600 |
| 2017 | $2,174 | $198,500 | $12,800 | $185,700 |
| 2016 | $2,203 | $197,600 | $11,900 | $185,700 |
| 2015 | $2,245 | $204,100 | $11,900 | $192,200 |
| 2014 | $2,184 | $204,100 | $11,900 | $192,200 |
| 2013 | -- | $204,100 | $11,900 | $192,200 |
Source: Public Records
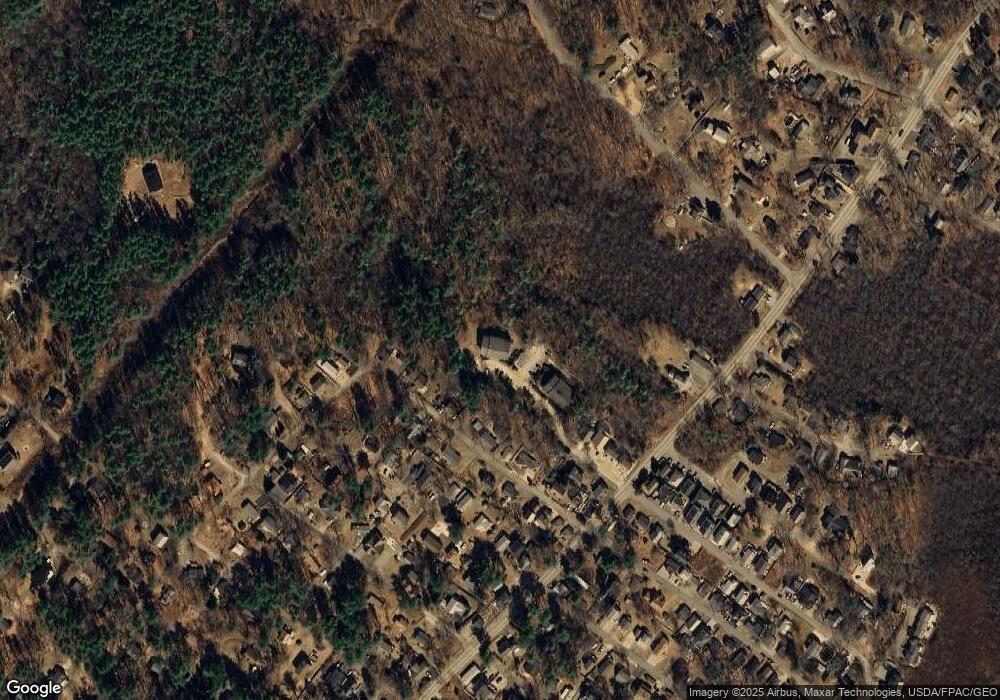
Map
Nearby Homes
- 6 Stoneridge Ln
- 35 Gunnison Rd
- 8 Surfore Rd
- 4 Surfore Dr
- 3 Cornish Ave
- 384 Ridge Rd
- 10 Amherst Ave Unit 10
- 10 Amherst Ave
- 10 Yorke Ridge Way
- 11 Ruch Ln
- 1 Ocean Ave Unit 306/308 Fraction 5
- 1 Ocean Ave Unit 306/308 Fraction 4
- 1 Ocean Ave Unit 406/408 Fraction 4
- 1 Ocean Ave Unit 210/212 Fraction 3
- 1 Ocean Ave Unit 402/404 Fraction 1
- 2 Beach St Unit 16
- 801 Us Route 1 Unit D2
- 801 U S Route 1 Unit K-3
- 23 Kerry Rd
- 6 Dingle Rd Unit 4
- 9 Stoneridge Ln Unit 23
- 9 Stoneridge Ln Unit 22
- 9 Stoneridge Ln Unit 21
- 9 Stoneridge Ln Unit 20
- 9 Stoneridge Ln Unit 19
- 9 Stoneridge Ln Unit 18
- 9 Stoneridge Ln Unit 17
- 9 Stoneridge Ln Unit 16
- 9 Stoneridge Ln Unit 14
- 9 Stoneridge Ln Unit 13
- 9 Stoneridge Ln
- 21 Norton Avenue Extension
- 23 Norton Avenue Extension
- 7 Stoneridge Ln Unit 12
- 7 Stoneridge Ln Unit 11
- 7 Stoneridge Ln Unit 10
- 7 Stoneridge Ln Unit 9
- 7 Stoneridge Ln Unit 8
- 7 Stoneridge Ln
- 7 Stoneridge Ln Unit 6