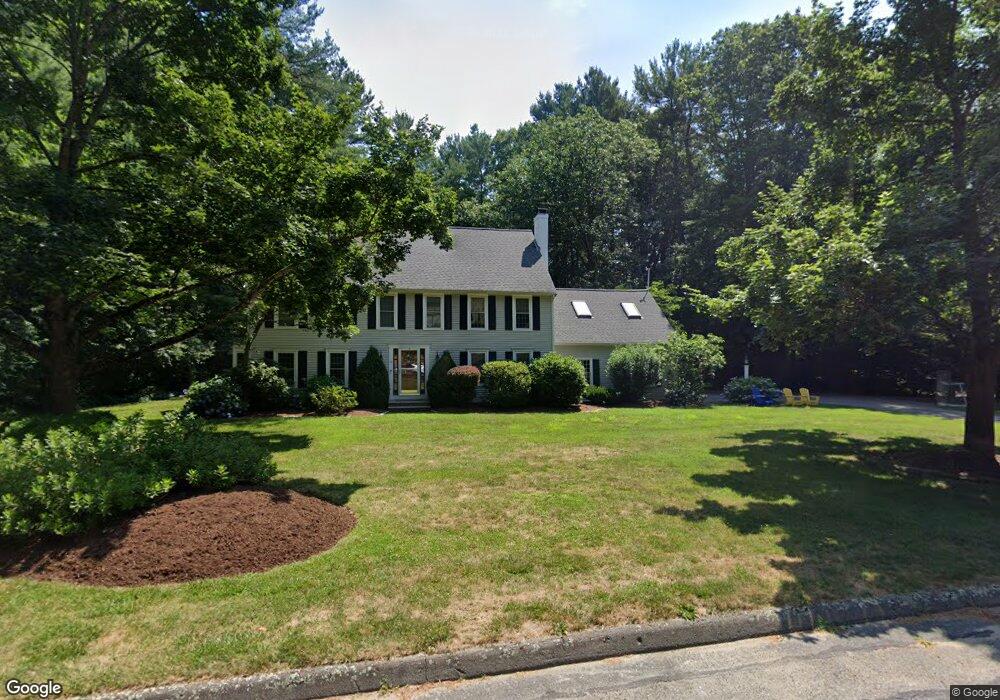
9 Stuart St Medfield, MA 02052
Estimated Value: $1,448,000 - $1,581,000
4
Beds
3
Baths
3,260
Sq Ft
$455/Sq Ft
Est. Value
About This Home
This home is located at 9 Stuart St, Medfield, MA 02052 and is currently estimated at $1,484,200, approximately $455 per square foot. 9 Stuart St is a home located in Norfolk County with nearby schools including Ralph Wheelock School, Memorial School, and Dale Street School.
Ownership History
Date
Name
Owned For
Owner Type
Purchase Details
Closed on
Dec 30, 2011
Sold by
Morra Anthony R Est and Relich
Bought by
Connor Penelope M and Conner Nicholas D
Current Estimated Value
Home Financials for this Owner
Home Financials are based on the most recent Mortgage that was taken out on this home.
Original Mortgage
$417,000
Outstanding Balance
$42,122
Interest Rate
4%
Mortgage Type
Purchase Money Mortgage
Estimated Equity
$1,442,078
Purchase Details
Closed on
Aug 24, 2009
Sold by
Underhill Carl A and Underhill Ellen M
Bought by
Hoffman Gregory G and Hoffman Jamie M
Purchase Details
Closed on
Nov 30, 1994
Sold by
Geary James and Geary Therese
Bought by
Underhill Carl A and Underhill Ellen M
Purchase Details
Closed on
Mar 17, 1989
Sold by
Ferraro James P
Bought by
Geary James
Purchase Details
Closed on
Feb 3, 1987
Sold by
Alamo Bldg Corp
Bought by
Ferraro James P
Create a Home Valuation Report for This Property
The Home Valuation Report is an in-depth analysis detailing your home's value as well as a comparison with similar homes in the area
Home Values in the Area
Average Home Value in this Area
Purchase History
| Date | Buyer | Sale Price | Title Company |
|---|---|---|---|
| Connor Penelope M | $245,000 | -- | |
| Connor Penelope M | $245,000 | -- | |
| Hoffman Gregory G | $748,500 | -- | |
| Hoffman Gregory G | $748,500 | -- | |
| Hoffman Gregory G | $748,500 | -- | |
| Underhill Carl A | $400,000 | -- | |
| Underhill Carl A | $400,000 | -- | |
| Geary James | $404,000 | -- | |
| Geary James | $404,000 | -- | |
| Ferraro James P | $395,000 | -- |
Source: Public Records
Mortgage History
| Date | Status | Borrower | Loan Amount |
|---|---|---|---|
| Open | Connor Penelope M | $417,000 | |
| Closed | Ferraro James P | $417,000 |
Source: Public Records
Tax History
| Year | Tax Paid | Tax Assessment Tax Assessment Total Assessment is a certain percentage of the fair market value that is determined by local assessors to be the total taxable value of land and additions on the property. | Land | Improvement |
|---|---|---|---|---|
| 2025 | $16,712 | $1,211,000 | $535,300 | $675,700 |
| 2024 | $16,227 | $1,108,400 | $480,100 | $628,300 |
| 2023 | $16,007 | $1,037,400 | $460,100 | $577,300 |
| 2022 | $15,251 | $875,500 | $440,100 | $435,400 |
| 2021 | $15,133 | $852,100 | $436,100 | $416,000 |
| 2020 | $14,788 | $829,400 | $426,100 | $403,300 |
| 2019 | $14,528 | $813,000 | $414,100 | $398,900 |
| 2018 | $13,961 | $819,800 | $400,100 | $419,700 |
| 2017 | $13,779 | $815,800 | $396,100 | $419,700 |
| 2016 | $13,665 | $815,800 | $396,100 | $419,700 |
| 2015 | $12,510 | $779,900 | $367,300 | $412,600 |
| 2014 | $11,811 | $732,700 | $320,100 | $412,600 |
Source: Public Records
Map
Nearby Homes
- 115 High St
- 25 Forest St
- 26 Dover Dr
- 111 Elm St
- 19 and 23 Arlington Ln
- 246 Pemberton St
- 15 Homestead Dr
- 260 Elm St
- 41 Gill St Unit A
- 56 North St
- 881 Main St Unit 9
- 17 Fairview Rd
- 137 Clear Pond Dr
- 20 Forrest Rd
- 127 Clear Pond Dr
- 31 Sandtrap Cir Unit 500
- 25 Sandtrap Cir Unit 8
- 29 Sandtrap Cir Unit 6
- 27 Sandtrap Cir Unit 7
- 21 Sandtrap Cir Unit 10
Your Personal Tour Guide
Ask me questions while you tour the home.