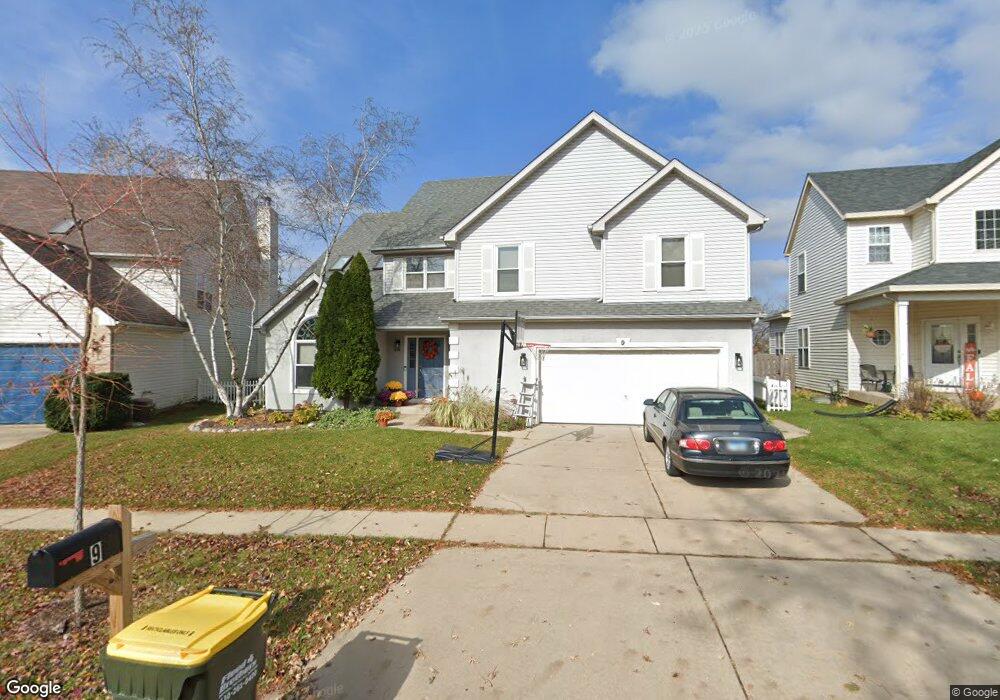
9 Sugar Creek Ct Lake In the Hills, IL 60156
Estimated Value: $394,000 - $453,515
4
Beds
3
Baths
2,684
Sq Ft
$157/Sq Ft
Est. Value
About This Home
This home is located at 9 Sugar Creek Ct, Lake In the Hills, IL 60156 and is currently estimated at $422,129, approximately $157 per square foot. 9 Sugar Creek Ct is a home located in McHenry County with nearby schools including Mackeben Elementary School, Conley Elementary School, and Heineman Middle School.
Ownership History
Date
Name
Owned For
Owner Type
Purchase Details
Closed on
Jun 23, 2009
Sold by
Federal National Mortgage Association
Bought by
Prather Megan A and Prather Justin J
Current Estimated Value
Home Financials for this Owner
Home Financials are based on the most recent Mortgage that was taken out on this home.
Original Mortgage
$191,290
Interest Rate
5.29%
Mortgage Type
FHA
Purchase Details
Closed on
Feb 23, 2009
Sold by
Parks
Bought by
Federal National Mortgage Association
Purchase Details
Closed on
Feb 13, 1997
Sold by
Allied Building Corp
Bought by
Parkway Bank & Trust
Purchase Details
Closed on
Oct 7, 1996
Sold by
Bayberry Development Company Ii Inc
Bought by
Allied Building Corp
Home Financials for this Owner
Home Financials are based on the most recent Mortgage that was taken out on this home.
Original Mortgage
$154,200
Interest Rate
7.6%
Mortgage Type
Construction
Create a Home Valuation Report for This Property
The Home Valuation Report is an in-depth analysis detailing your home's value as well as a comparison with similar homes in the area
Home Values in the Area
Average Home Value in this Area
Purchase History
| Date | Buyer | Sale Price | Title Company |
|---|---|---|---|
| Prather Megan A | $214,900 | Nlt Title Llc | |
| Federal National Mortgage Association | $275,942 | None Available | |
| Parkway Bank & Trust | -- | Chicago Title Insurance Co | |
| Allied Building Corp | -- | -- |
Source: Public Records
Mortgage History
| Date | Status | Borrower | Loan Amount |
|---|---|---|---|
| Previous Owner | Prather Megan A | $191,290 | |
| Previous Owner | Allied Building Corp | $154,200 |
Source: Public Records
Tax History Compared to Growth
Tax History
| Year | Tax Paid | Tax Assessment Tax Assessment Total Assessment is a certain percentage of the fair market value that is determined by local assessors to be the total taxable value of land and additions on the property. | Land | Improvement |
|---|---|---|---|---|
| 2024 | $8,825 | $127,346 | $7,919 | $119,427 |
| 2023 | $8,595 | $114,397 | $7,114 | $107,283 |
| 2022 | $8,208 | $104,168 | $6,478 | $97,690 |
| 2021 | $7,953 | $98,105 | $6,101 | $92,004 |
| 2020 | $7,843 | $95,488 | $5,938 | $89,550 |
| 2019 | $7,653 | $93,050 | $5,786 | $87,264 |
| 2018 | $7,667 | $91,466 | $6,512 | $84,954 |
| 2017 | $7,521 | $86,199 | $6,137 | $80,062 |
| 2016 | $7,590 | $81,954 | $5,835 | $76,119 |
| 2013 | -- | $81,548 | $12,346 | $69,202 |
Source: Public Records
Map
Nearby Homes
- 1578 Grouse Way
- 10 Barrington Ct
- 10 Ronan Ct
- 9103 Miller Rd Unit 4
- 9103 Miller Rd Unit 5
- 9103 Miller Rd Unit 3
- 9103 Miller Rd Unit 2
- 9103 Miller Rd Unit 1
- 1484 Rolling Hills Dr
- 9012 Swanson Rd
- 3218 Impressions Dr
- 2948 Impressions Dr
- 1657 Flagstone Dr
- 20 Dogwood Ct
- 4535 Heron Dr
- 1582 Dogwood Dr Unit 4
- 2191 Litchfield Ln
- 2521 Waterford Ln
- 2 Melbourne Ct
- 1849 Moorland Ln
- 11 Sugar Creek Ct
- 7 Sugar Creek Ct
- 13 Sugar Creek Ct
- 5 Sugar Creek Ct Unit 5
- 6 Sugar Creek Ct
- 4 Sugar Creek Ct
- 15 Sugar Creek Ct
- 8 Sugar Creek Ct
- 3 Sugar Creek Ct
- 2 Sugar Creek Ct
- 17 Sugar Creek Ct Unit 5
- 4333 Rolling Hills Dr
- 1 Sugar Creek Ct
- 4323 Rolling Hills Dr
- 16 Sugar Creek Ct
- 4363 Rolling Hills Dr
- 14 Sugar Creek Ct
- 19 Sugar Creek Ct
- 12 Sugar Creek Ct
- 4373 Rolling Hills Dr