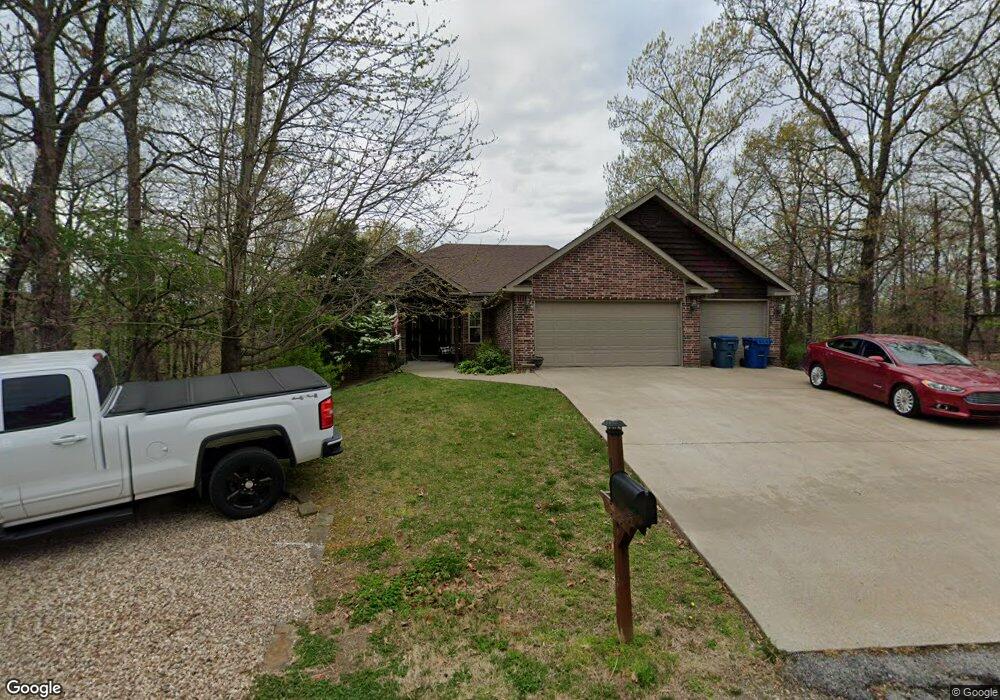
9 Sutherland Ln Bella Vista, AR 72714
Estimated Value: $395,329 - $439,000
--
Bed
2
Baths
1,928
Sq Ft
$215/Sq Ft
Est. Value
About This Home
This home is located at 9 Sutherland Ln, Bella Vista, AR 72714 and is currently estimated at $414,082, approximately $214 per square foot. 9 Sutherland Ln is a home located in Benton County with nearby schools including Cooper Elementary School, Old High Middle School, and Washington Junior High School.
Ownership History
Date
Name
Owned For
Owner Type
Purchase Details
Closed on
Sep 22, 2008
Sold by
Shoulders Robert D and Shoulders Priscilla G
Bought by
Shoulders Robert D and Shoulders Priscilla G
Current Estimated Value
Purchase Details
Closed on
Jun 21, 2006
Sold by
Msm Enterprises Llc
Bought by
Shoulders Robert D
Home Financials for this Owner
Home Financials are based on the most recent Mortgage that was taken out on this home.
Original Mortgage
$180,800
Outstanding Balance
$106,652
Interest Rate
6.63%
Mortgage Type
Purchase Money Mortgage
Estimated Equity
$307,430
Purchase Details
Closed on
Feb 24, 2005
Sold by
Blevins Ann M and Humphrys Ann M
Bought by
Msm Enterprise Llc
Purchase Details
Closed on
May 16, 2003
Bought by
Humphrys Tr
Purchase Details
Closed on
Jul 5, 1996
Bought by
Humphrys
Purchase Details
Closed on
Jul 2, 1996
Bought by
Summit
Purchase Details
Closed on
Sep 28, 1981
Bought by
Vogt
Create a Home Valuation Report for This Property
The Home Valuation Report is an in-depth analysis detailing your home's value as well as a comparison with similar homes in the area
Home Values in the Area
Average Home Value in this Area
Purchase History
| Date | Buyer | Sale Price | Title Company |
|---|---|---|---|
| Shoulders Robert D | -- | None Available | |
| Shoulders Robert D | $226,000 | Lenders Title Company | |
| Msm Enterprise Llc | $6,000 | Bronson Title Services Inc | |
| Humphrys Tr | -- | -- | |
| Humphrys | $1,000 | -- | |
| Lakeside Mgt | $1,000 | -- | |
| Summit | $1,000 | -- | |
| Lakeside Mgt | $2,000 | -- | |
| Vogt | $9,000 | -- |
Source: Public Records
Mortgage History
| Date | Status | Borrower | Loan Amount |
|---|---|---|---|
| Open | Shoulders Robert D | $180,800 |
Source: Public Records
Tax History Compared to Growth
Tax History
| Year | Tax Paid | Tax Assessment Tax Assessment Total Assessment is a certain percentage of the fair market value that is determined by local assessors to be the total taxable value of land and additions on the property. | Land | Improvement |
|---|---|---|---|---|
| 2025 | $2,195 | $74,071 | $1,600 | $72,471 |
| 2024 | $2,173 | $74,071 | $1,600 | $72,471 |
| 2023 | $2,173 | $49,850 | $800 | $49,050 |
| 2022 | $1,868 | $49,850 | $800 | $49,050 |
| 2021 | $1,863 | $49,850 | $800 | $49,050 |
| 2020 | $1,883 | $37,860 | $600 | $37,260 |
| 2019 | $1,883 | $37,860 | $600 | $37,260 |
| 2018 | $1,908 | $37,860 | $600 | $37,260 |
| 2017 | $1,823 | $37,860 | $600 | $37,260 |
| 2016 | $1,823 | $37,860 | $600 | $37,260 |
| 2015 | $2,138 | $35,450 | $1,000 | $34,450 |
| 2014 | $1,788 | $35,450 | $1,000 | $34,450 |
Source: Public Records
Map
Nearby Homes
- Lots 2&3 Flory Ln
- 1 Lynn Ln
- 4 Beckfoot Ln
- 0 Damerham Ln
- 22 Dillow Cir
- 6 Carole Rae Ln
- 17 Duxford Cir
- 7 Wrongton Dr
- 6 Chippenham Ln
- 13 Berkshire Dr
- 10 Dillow Ln
- 14 Constance Cir
- 67 Fairway Dr
- Lot 35 Rutland Dr
- 6 Didcot Ln
- 11 Wiltshire Dr
- 26 Wiltshire Dr
- 0 Modbury Cir
- Lot 15 Aylsham Ln
- Lot 14 Melanie Dr
- L25, B4 Sutherland Ln Trafal
- 5 Sutherland Ln
- 13 Sutherland Ln
- 6 Sutherland Ln
- 15 Sutherland Ln
- 7 Sean Ln
- 7 Sean Ln
- 16 Sutherland Ln
- 4 Sean Ln
- 2 Sutherland Ln
- 2 Sutherland Ln
- 21 Sutherland Ln
- 18 Sutherland Ln
- -- Sean Ln
- 2 Sean Ln
- 9 Flory Ln
- 0 Lot 2 Block 4 Sutherland Ln Unit 1230883
- 22 Sutherland Ln
- . Lynn Ln
- 8340 Trafalgar Rd