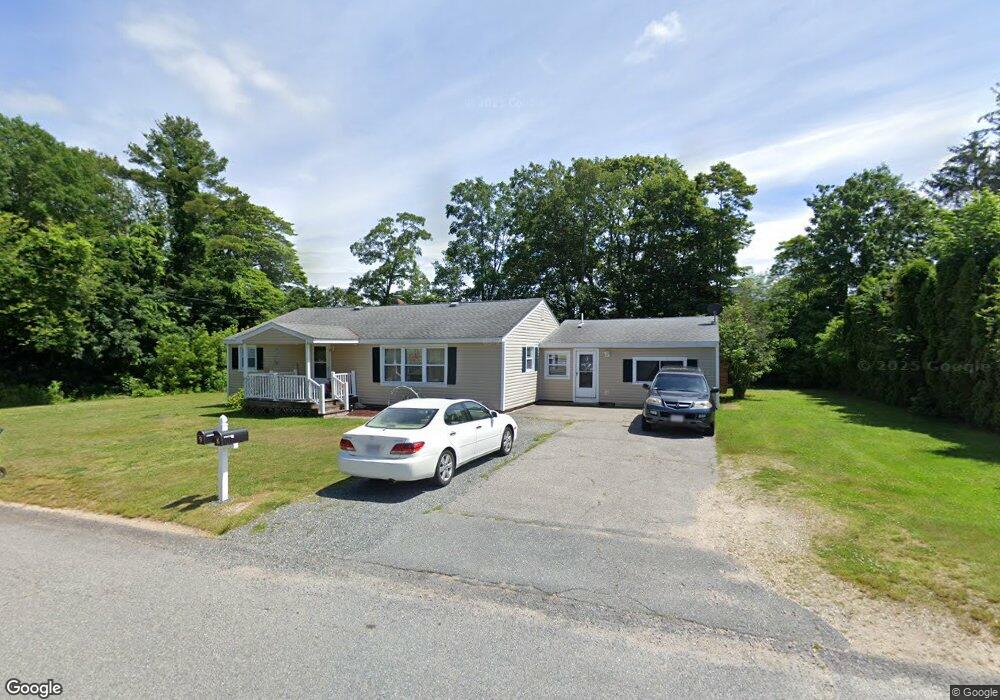
9 Sylvana St Westport, MA 02790
North Westport NeighborhoodEstimated Value: $493,028 - $638,000
4
Beds
--
Bath
2,024
Sq Ft
$268/Sq Ft
Est. Value
About This Home
This home is located at 9 Sylvana St, Westport, MA 02790 and is currently estimated at $542,007, approximately $267 per square foot. 9 Sylvana St is a home located in Bristol County with nearby schools including Alice A. Macomber Primary School, Westport Elementary School, and Westport Middle-High School.
Ownership History
Date
Name
Owned For
Owner Type
Purchase Details
Closed on
Nov 10, 2015
Sold by
Liberty Linda Q and Liberty David C
Bought by
Quintal Raymond P
Current Estimated Value
Home Financials for this Owner
Home Financials are based on the most recent Mortgage that was taken out on this home.
Original Mortgage
$175,000
Outstanding Balance
$138,065
Interest Rate
3.88%
Mortgage Type
New Conventional
Estimated Equity
$403,942
Create a Home Valuation Report for This Property
The Home Valuation Report is an in-depth analysis detailing your home's value as well as a comparison with similar homes in the area
Home Values in the Area
Average Home Value in this Area
Purchase History
| Date | Buyer | Sale Price | Title Company |
|---|---|---|---|
| Quintal Raymond P | $35,302 | -- | |
| Quintal Raymond P | $54,257 | -- |
Source: Public Records
Mortgage History
| Date | Status | Borrower | Loan Amount |
|---|---|---|---|
| Open | Quintal Raymond P | $175,000 |
Source: Public Records
Tax History Compared to Growth
Tax History
| Year | Tax Paid | Tax Assessment Tax Assessment Total Assessment is a certain percentage of the fair market value that is determined by local assessors to be the total taxable value of land and additions on the property. | Land | Improvement |
|---|---|---|---|---|
| 2025 | $3,009 | $403,900 | $159,900 | $244,000 |
| 2024 | $3,007 | $389,000 | $148,200 | $240,800 |
| 2023 | $2,888 | $353,900 | $135,000 | $218,900 |
| 2022 | $2,625 | $309,500 | $122,700 | $186,800 |
| 2021 | $2,571 | $298,300 | $111,500 | $186,800 |
| 2020 | $2,478 | $293,900 | $107,100 | $186,800 |
| 2019 | $2,406 | $290,900 | $107,100 | $183,800 |
| 2018 | $2,320 | $284,000 | $115,200 | $168,800 |
| 2017 | $2,221 | $278,700 | $115,200 | $163,500 |
| 2016 | $2,094 | $264,700 | $115,200 | $149,500 |
| 2015 | $1,983 | $250,000 | $115,200 | $134,800 |
Source: Public Records
Map
Nearby Homes