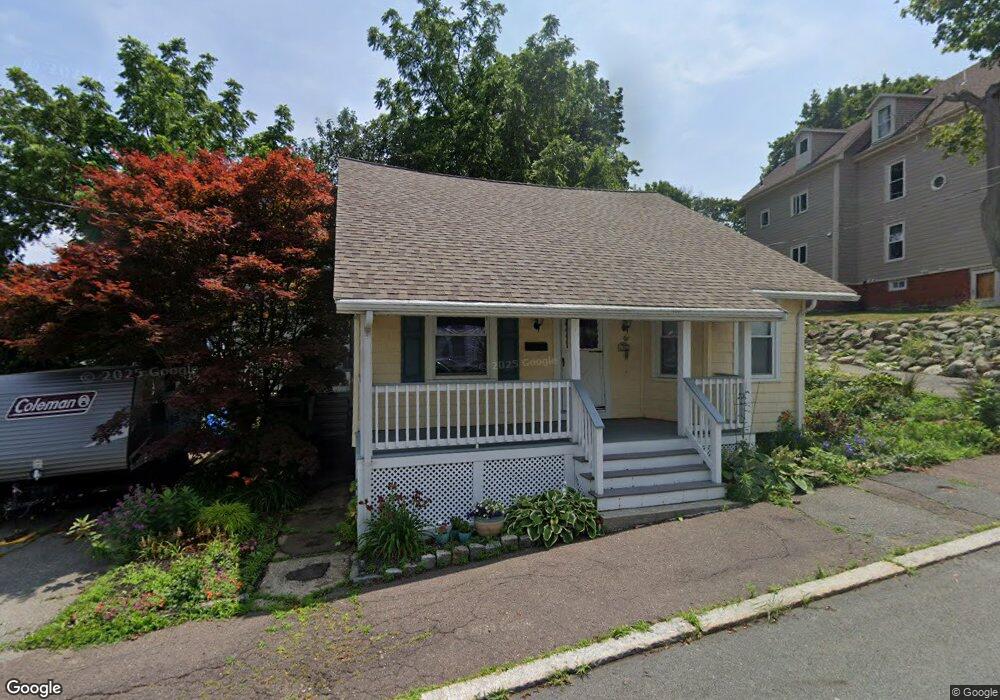
9 Symonds St Salem, MA 01970
North Salem NeighborhoodEstimated Value: $526,642 - $1,129,000
3
Beds
1
Bath
1,608
Sq Ft
$452/Sq Ft
Est. Value
About This Home
This home is located at 9 Symonds St, Salem, MA 01970 and is currently estimated at $726,661, approximately $451 per square foot. 9 Symonds St is a home located in Essex County with nearby schools including Bates Elementary School, Witchcraft Heights Elementary School, and Saltonstall School.
Ownership History
Date
Name
Owned For
Owner Type
Purchase Details
Closed on
Jun 30, 1999
Sold by
Albiero Sharon A and Albiero Michael J
Bought by
Delorenzo Charles R and Delorenzo Jennifer
Current Estimated Value
Purchase Details
Closed on
Sep 30, 1998
Sold by
Salem Hourihan Ft
Bought by
Albiero Michael J and Albiero Sharon A
Create a Home Valuation Report for This Property
The Home Valuation Report is an in-depth analysis detailing your home's value as well as a comparison with similar homes in the area
Home Values in the Area
Average Home Value in this Area
Purchase History
| Date | Buyer | Sale Price | Title Company |
|---|---|---|---|
| Delorenzo Charles R | $163,000 | -- | |
| Albiero Michael J | $86,147 | -- |
Source: Public Records
Mortgage History
| Date | Status | Borrower | Loan Amount |
|---|---|---|---|
| Closed | Albiero Michael J | $126,000 | |
| Closed | Albiero Michael J | $150,000 | |
| Closed | Albiero Michael J | $30,000 |
Source: Public Records
Tax History Compared to Growth
Tax History
| Year | Tax Paid | Tax Assessment Tax Assessment Total Assessment is a certain percentage of the fair market value that is determined by local assessors to be the total taxable value of land and additions on the property. | Land | Improvement |
|---|---|---|---|---|
| 2025 | $4,731 | $417,200 | $196,000 | $221,200 |
| 2024 | $4,619 | $397,500 | $186,200 | $211,300 |
| 2023 | $4,422 | $353,500 | $171,900 | $181,600 |
| 2022 | $4,496 | $339,300 | $166,200 | $173,100 |
| 2021 | $4,216 | $305,500 | $154,700 | $150,800 |
| 2020 | $4,303 | $297,800 | $146,100 | $151,700 |
| 2019 | $4,279 | $283,400 | $138,700 | $144,700 |
| 2018 | $4,306 | $280,000 | $131,800 | $148,200 |
| 2017 | $3,992 | $251,700 | $111,200 | $140,500 |
| 2016 | $3,863 | $246,500 | $106,000 | $140,500 |
| 2015 | $3,740 | $227,900 | $97,400 | $130,500 |
Source: Public Records
Map
Nearby Homes
- 170 North St
- 27 Appleton St
- 19 Cushing St
- 36 Irving St Unit B
- 8 Upham St
- 112 North St
- 3 S Mason St
- 14 Margin St
- 41 Dearborn St
- 5 Larchmont Rd Unit 3
- 18 Franklin St Unit 402
- 18 Franklin St Unit 303
- 97 Mason St Unit 2
- 78 Federal St
- 128 Boston St Unit 4
- 145 Federal St Unit 3
- 145 Boston St
- 47 Federal St
- 35 Flint St Unit 209
- 35 Flint St Unit 106
- 11 Symonds St
- 11 Symonds St Unit 3
- 11 Symonds St Unit 2
- 10 Symonds St
- 10 Symonds St Unit 3
- 10 Symonds St Unit 1
- 61 Buffum St
- 12 Symonds St
- 15 Symonds St
- 57 Buffum St
- 57 Buffum St Unit 1
- 57 Buffum St Unit 3
- 57 Buffum St Unit 2
- 17 Bryant St
- 17 Bryant St
- 17 Bryant St Unit 2
- 17 Bryant St Unit 3
- 14 Symonds St
- 13 Bryant St
- 11 Bryant St Unit 13