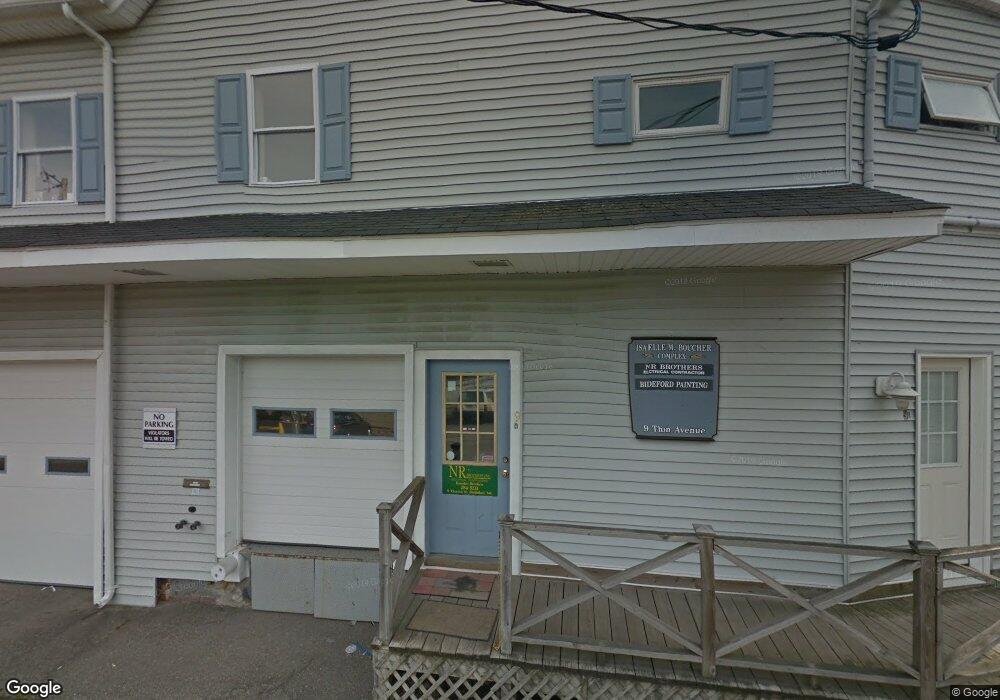
9 Thornton St Biddeford, ME 04005
Downtown Biddeford NeighborhoodEstimated Value: $431,200
--
Bed
1
Bath
8,988
Sq Ft
$48/Sq Ft
Est. Value
About This Home
This home is located at 9 Thornton St, Biddeford, ME 04005 and is currently priced at $431,200, approximately $47 per square foot. 9 Thornton St is a home located in York County with nearby schools including John F Kennedy Memorial School, Biddeford Primary School, and Biddeford Intermediate School.
Ownership History
Date
Name
Owned For
Owner Type
Purchase Details
Closed on
Aug 3, 2021
Sold by
Boucher Robert and Boucher Nelson
Bought by
Cspn Llc
Current Estimated Value
Home Financials for this Owner
Home Financials are based on the most recent Mortgage that was taken out on this home.
Original Mortgage
$520,000
Outstanding Balance
$473,546
Interest Rate
3%
Mortgage Type
Purchase Money Mortgage
Create a Home Valuation Report for This Property
The Home Valuation Report is an in-depth analysis detailing your home's value as well as a comparison with similar homes in the area
Home Values in the Area
Average Home Value in this Area
Purchase History
| Date | Buyer | Sale Price | Title Company |
|---|---|---|---|
| Cspn Llc | -- | None Available |
Source: Public Records
Mortgage History
| Date | Status | Borrower | Loan Amount |
|---|---|---|---|
| Open | Cspn Llc | $520,000 |
Source: Public Records
Tax History Compared to Growth
Tax History
| Year | Tax Paid | Tax Assessment Tax Assessment Total Assessment is a certain percentage of the fair market value that is determined by local assessors to be the total taxable value of land and additions on the property. | Land | Improvement |
|---|---|---|---|---|
| 2024 | $4,445 | $312,600 | $154,200 | $158,400 |
| 2023 | $4,101 | $312,600 | $154,200 | $158,400 |
| 2022 | $3,458 | $210,700 | $94,900 | $115,800 |
| 2021 | $3,473 | $190,500 | $94,900 | $95,600 |
| 2020 | $3,583 | $178,700 | $94,900 | $83,800 |
| 2019 | $3,570 | $178,700 | $94,900 | $83,800 |
| 2018 | $3,520 | $178,700 | $94,900 | $83,800 |
| 2017 | $64 | $176,100 | $94,900 | $81,200 |
| 2016 | $3,184 | $160,300 | $47,500 | $112,800 |
| 2015 | $3,121 | $160,300 | $47,500 | $112,800 |
| 2014 | $3,044 | $160,300 | $47,500 | $112,800 |
| 2013 | -- | $153,200 | $54,000 | $99,200 |
Source: Public Records
Map
Nearby Homes
- 20 Hooper St
- 28 Cutts St
- 4 Kossuth St
- 6 Maple St
- 20 Upper Falls Rd Unit 501
- 20 Upper Falls Rd Unit 403
- 38 South St
- 26 Upper Falls Rd Unit 107
- 26 Upper Falls Rd Unit 108
- 38 Jefferson St
- 2 Main St Unit 17-506
- 2 Main St Unit 15-310
- 2 Main St Unit 18-420
- 2 Main St Unit 15-314
- 2 Main St Unit 17-410
- 2 Main St Unit 17-508
- 2 Main St Unit 15-403
- 2 Main St Unit 17-407
- 2 Main St Unit 18-307
- 2 Main St Unit 15-311