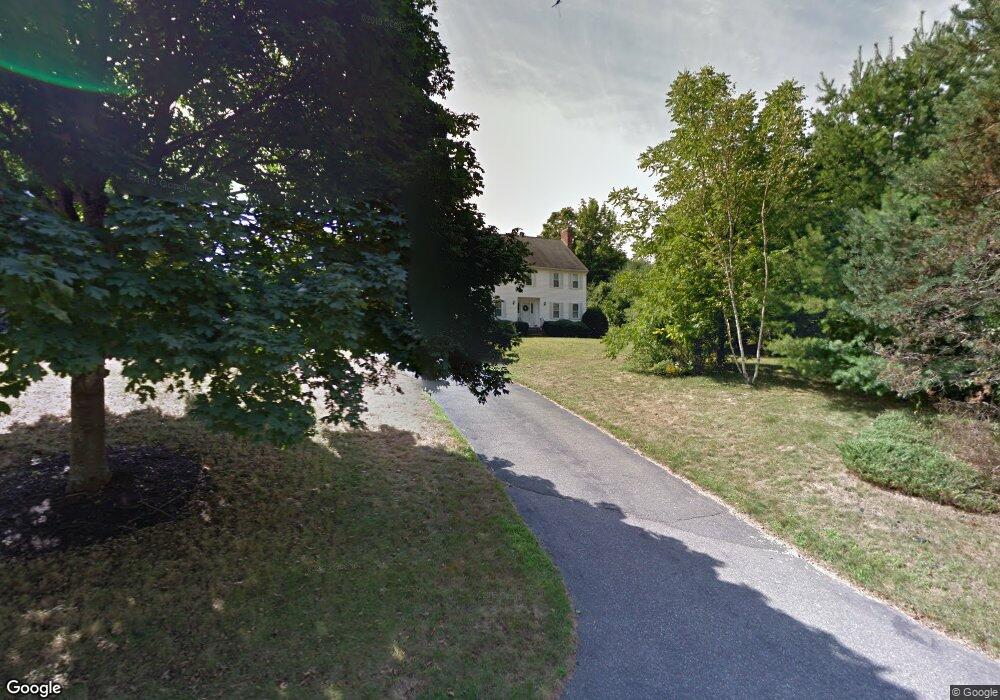
9 Tidd Cir Lexington, MA 02420
North Lexington NeighborhoodEstimated Value: $1,637,166 - $1,909,000
4
Beds
3
Baths
2,660
Sq Ft
$675/Sq Ft
Est. Value
About This Home
This home is located at 9 Tidd Cir, Lexington, MA 02420 and is currently estimated at $1,795,542, approximately $675 per square foot. 9 Tidd Cir is a home located in Middlesex County with nearby schools including Joseph Estabrook Elementary School, William Diamond Middle School, and Lexington High School.
Ownership History
Date
Name
Owned For
Owner Type
Purchase Details
Closed on
Sep 19, 2024
Sold by
Geller David and Geller Jennifer T
Bought by
9 Tidd Circle Rt and Geller
Current Estimated Value
Purchase Details
Closed on
Jul 15, 2005
Sold by
Rhee Kyung O and Rhee William B
Bought by
Geller David and Geller Jennifer Towle
Purchase Details
Closed on
May 15, 1987
Sold by
L T V Rlty Trust
Bought by
Rhee William B
Create a Home Valuation Report for This Property
The Home Valuation Report is an in-depth analysis detailing your home's value as well as a comparison with similar homes in the area
Home Values in the Area
Average Home Value in this Area
Purchase History
| Date | Buyer | Sale Price | Title Company |
|---|---|---|---|
| 9 Tidd Circle Rt | -- | None Available | |
| 9 Tidd Circle Rt | -- | None Available | |
| Geller David | $892,000 | -- | |
| Geller David | $892,000 | -- | |
| Rhee William B | $366,000 | -- |
Source: Public Records
Mortgage History
| Date | Status | Borrower | Loan Amount |
|---|---|---|---|
| Previous Owner | Rhee William B | $297,000 | |
| Previous Owner | Rhee William B | $175,000 |
Source: Public Records
Tax History Compared to Growth
Tax History
| Year | Tax Paid | Tax Assessment Tax Assessment Total Assessment is a certain percentage of the fair market value that is determined by local assessors to be the total taxable value of land and additions on the property. | Land | Improvement |
|---|---|---|---|---|
| 2025 | $20,143 | $1,647,000 | $800,000 | $847,000 |
| 2024 | $19,686 | $1,607,000 | $761,000 | $846,000 |
| 2023 | $19,318 | $1,486,000 | $692,000 | $794,000 |
| 2022 | $18,147 | $1,315,000 | $629,000 | $686,000 |
| 2021 | $6,477 | $1,228,000 | $599,000 | $629,000 |
| 2020 | $17,057 | $1,214,000 | $599,000 | $615,000 |
| 2019 | $5,924 | $1,160,000 | $571,000 | $589,000 |
| 2018 | $5,636 | $1,122,000 | $544,000 | $578,000 |
| 2017 | $15,504 | $1,070,000 | $527,000 | $543,000 |
| 2016 | $14,863 | $1,018,000 | $484,000 | $534,000 |
| 2015 | $14,355 | $966,000 | $448,000 | $518,000 |
| 2014 | $12,361 | $797,000 | $397,000 | $400,000 |
Source: Public Records
Map
Nearby Homes
- 18 Robinson Rd
- 101 Burlington St
- 25 Flintlock Rd
- 125 Burlington St
- 3a Nowers Rd
- 103 N Hancock St
- 17 Hamilton Rd
- 231 Bedford St
- 18 Heritage Dr
- 24 Vaille Ave
- 12 Coolidge Ave
- 36 Adams St
- 83 Winter St
- 93 Bedford St Unit 201
- 93 Bedford St Unit 308
- 93 Bedford St Unit 101
- 3 Brown Rd
- 45 Hancock St
- 75 Westview St
- 32 Edgewood Rd Unit 1