9 Tiger Row Georgetown, MA 01833
Estimated Value: $1,109,570 - $1,239,000
4
Beds
4
Baths
4,027
Sq Ft
$293/Sq Ft
Est. Value
About This Home
This home is located at 9 Tiger Row, Georgetown, MA 01833 and is currently estimated at $1,178,643, approximately $292 per square foot. 9 Tiger Row is a home located in Essex County with nearby schools including Perley Elementary School, Penn Brook School, and Georgetown High School.
Ownership History
Date
Name
Owned For
Owner Type
Purchase Details
Closed on
Jun 1, 2016
Sold by
Perry Mark A and Perry Elizabeth A
Bought by
Elizabeth A Perry Ret
Current Estimated Value
Purchase Details
Closed on
Mar 11, 1994
Sold by
Thurlow Nt and Perry Charles R
Bought by
Perry Mark A and Perry Elizabeth
Create a Home Valuation Report for This Property
The Home Valuation Report is an in-depth analysis detailing your home's value as well as a comparison with similar homes in the area
Home Values in the Area
Average Home Value in this Area
Purchase History
| Date | Buyer | Sale Price | Title Company |
|---|---|---|---|
| Elizabeth A Perry Ret | -- | -- | |
| Perry Mark A | $87,000 | -- |
Source: Public Records
Mortgage History
| Date | Status | Borrower | Loan Amount |
|---|---|---|---|
| Previous Owner | Perry Mark A | $142,000 | |
| Previous Owner | Perry Mark A | $30,000 | |
| Previous Owner | Perry Mark A | $162,300 | |
| Previous Owner | Perry Mark A | $207,000 |
Source: Public Records
Tax History
| Year | Tax Paid | Tax Assessment Tax Assessment Total Assessment is a certain percentage of the fair market value that is determined by local assessors to be the total taxable value of land and additions on the property. | Land | Improvement |
|---|---|---|---|---|
| 2025 | $12,232 | $1,106,000 | $325,400 | $780,600 |
| 2024 | $12,148 | $968,000 | $225,600 | $742,400 |
| 2023 | $12,565 | $968,000 | $225,600 | $742,400 |
| 2022 | $12,165 | $864,000 | $196,600 | $667,400 |
| 2021 | $11,776 | $741,100 | $196,600 | $544,500 |
| 2020 | $11,798 | $741,100 | $196,600 | $544,500 |
| 2019 | $11,638 | $737,500 | $193,000 | $544,500 |
| 2018 | $10,919 | $687,600 | $193,000 | $494,600 |
| 2017 | $10,502 | $647,900 | $193,000 | $454,900 |
| 2016 | $10,143 | $639,100 | $193,000 | $446,100 |
| 2015 | $9,897 | $617,400 | $193,000 | $424,400 |
| 2014 | $8,674 | $617,400 | $193,000 | $424,400 |
Source: Public Records
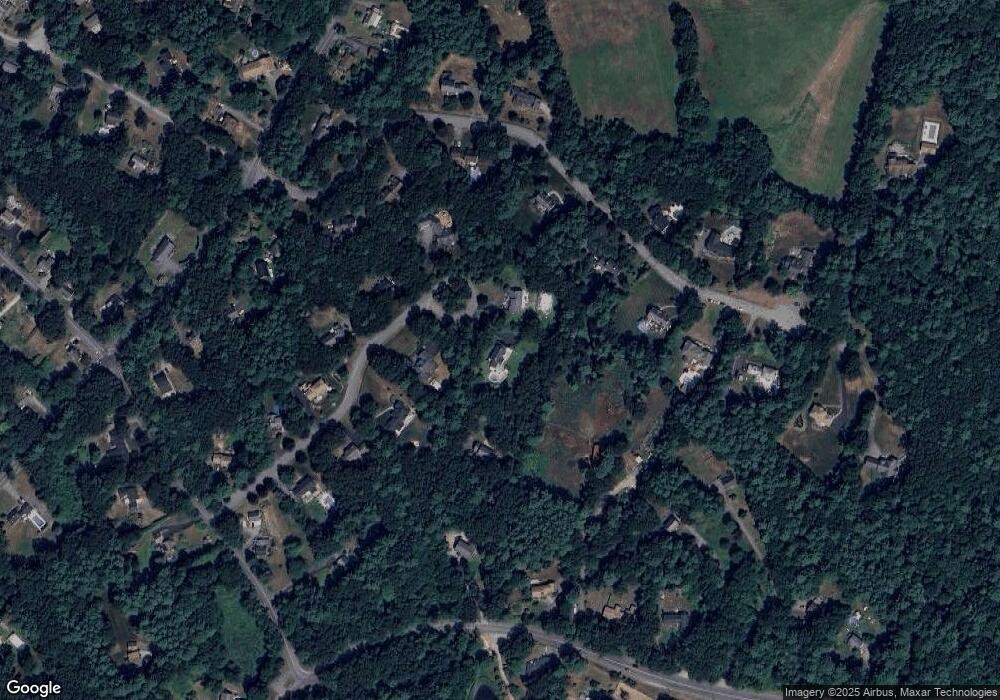
Map
Nearby Homes
- 66 Parish Rd Unit 8
- 66 Parish Rd Unit 4
- 11 Main St
- 13 Main St
- 38 Main St
- 18 Forest St
- 34 Central St
- 8 Molloy Rd
- 17 Church St
- 5 Oak Terrace
- 32 Summer St
- 38 Pearson Dr
- 33 Downfall Rd
- 55 Pearson Dr Unit 9 - ALDER
- 55 Pearson Dr Unit 8-Dogwood
- 55 Pearson Dr Unit 11-Chestnut
- 55 Pearson Dr Unit 3 - ALDER
- 55 Pearson Dr Unit 6-Dogwood
- 51 W Main St Unit 6
- 11 Central St
Your Personal Tour Guide
Ask me questions while you tour the home.