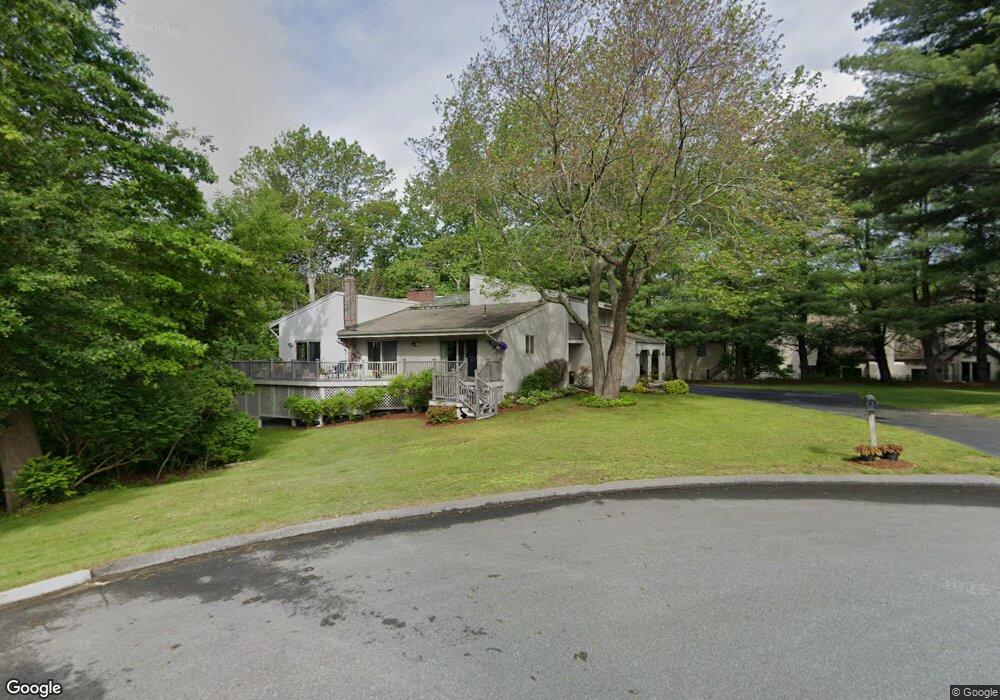
9 Todd Ln Lynnfield, MA 01940
Estimated Value: $1,605,238 - $1,860,000
4
Beds
3
Baths
3,831
Sq Ft
$442/Sq Ft
Est. Value
About This Home
This home is located at 9 Todd Ln, Lynnfield, MA 01940 and is currently estimated at $1,694,560, approximately $442 per square foot. 9 Todd Ln is a home located in Essex County with nearby schools including Lynnfield Middle School, Pickering Middle School, and Lynnfield High School.
Ownership History
Date
Name
Owned For
Owner Type
Purchase Details
Closed on
Oct 31, 2005
Sold by
Nance Michael E and Nance Tammy G
Bought by
Provance Stephen M
Current Estimated Value
Purchase Details
Closed on
Aug 27, 1998
Sold by
Munroe George J and Munroe Helen M
Bought by
Nance Michael E and Nance Tammy G
Purchase Details
Closed on
Aug 8, 1994
Sold by
Salem Five Sb
Bought by
Munroe George I and Munroe Helen M
Purchase Details
Closed on
Dec 1, 1989
Sold by
Zullo Loretta
Bought by
Catricala Victor
Create a Home Valuation Report for This Property
The Home Valuation Report is an in-depth analysis detailing your home's value as well as a comparison with similar homes in the area
Home Values in the Area
Average Home Value in this Area
Purchase History
| Date | Buyer | Sale Price | Title Company |
|---|---|---|---|
| Provance Stephen M | $893,334 | -- | |
| Nance Michael E | $520,000 | -- | |
| Munroe George I | $249,000 | -- | |
| Catricala Victor | $385,000 | -- |
Source: Public Records
Mortgage History
| Date | Status | Borrower | Loan Amount |
|---|---|---|---|
| Open | Catricala Victor | $310,500 | |
| Closed | Catricala Victor | $375,000 |
Source: Public Records
Tax History Compared to Growth
Tax History
| Year | Tax Paid | Tax Assessment Tax Assessment Total Assessment is a certain percentage of the fair market value that is determined by local assessors to be the total taxable value of land and additions on the property. | Land | Improvement |
|---|---|---|---|---|
| 2025 | $13,459 | $1,274,500 | $678,000 | $596,500 |
| 2024 | $12,440 | $1,183,600 | $627,800 | $555,800 |
| 2023 | $12,227 | $1,082,000 | $574,500 | $507,500 |
| 2022 | $12,166 | $1,014,700 | $574,500 | $440,200 |
| 2021 | $10,808 | $814,500 | $396,800 | $417,700 |
| 2020 | $10,870 | $780,900 | $361,200 | $419,700 |
| 2019 | $10,862 | $780,900 | $361,200 | $419,700 |
| 2018 | $10,745 | $780,900 | $361,200 | $419,700 |
| 2017 | $10,132 | $735,300 | $343,500 | $391,800 |
| 2016 | $9,687 | $668,100 | $331,000 | $337,100 |
| 2015 | $9,148 | $631,300 | $330,700 | $300,600 |
Source: Public Records
Map
Nearby Homes