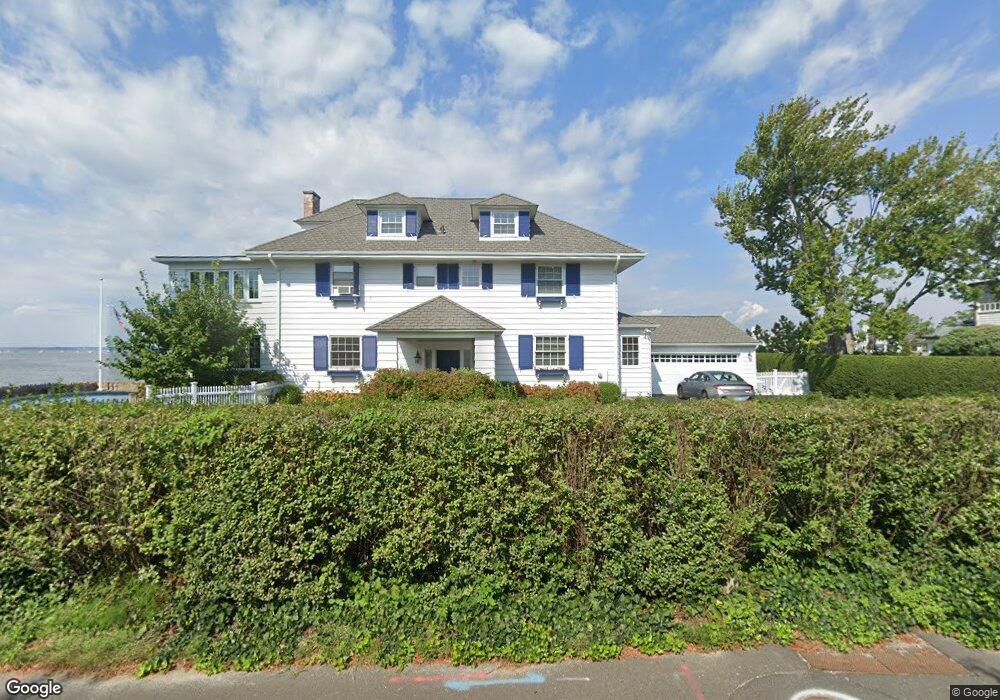
9 Tods Driftway Old Greenwich, CT 06870
Old Greenwich NeighborhoodEstimated Value: $5,729,000 - $6,497,000
8
Beds
4
Baths
4,823
Sq Ft
$1,255/Sq Ft
Est. Value
About This Home
This home is located at 9 Tods Driftway, Old Greenwich, CT 06870 and is currently estimated at $6,050,547, approximately $1,254 per square foot. 9 Tods Driftway is a home located in Fairfield County with nearby schools including Old Greenwich School, Eastern Middle School, and Greenwich High School.
Ownership History
Date
Name
Owned For
Owner Type
Purchase Details
Closed on
Dec 4, 2017
Sold by
Lucen Ducret Ret
Bought by
Ducret Carol
Current Estimated Value
Purchase Details
Closed on
Jun 30, 2016
Sold by
Ducret Carol and Ducret Lucien
Bought by
Ducret Carol and Ducret Lucien
Create a Home Valuation Report for This Property
The Home Valuation Report is an in-depth analysis detailing your home's value as well as a comparison with similar homes in the area
Home Values in the Area
Average Home Value in this Area
Purchase History
| Date | Buyer | Sale Price | Title Company |
|---|---|---|---|
| Ducret Carol | -- | -- | |
| Ducret Carol | -- | -- |
Source: Public Records
Mortgage History
| Date | Status | Borrower | Loan Amount |
|---|---|---|---|
| Previous Owner | Ducret Carol | $369,000 | |
| Previous Owner | Ducret Carol | $417,000 |
Source: Public Records
Tax History Compared to Growth
Tax History
| Year | Tax Paid | Tax Assessment Tax Assessment Total Assessment is a certain percentage of the fair market value that is determined by local assessors to be the total taxable value of land and additions on the property. | Land | Improvement |
|---|---|---|---|---|
| 2025 | $43,929 | $3,554,390 | $2,973,950 | $580,440 |
| 2024 | $42,425 | $3,554,390 | $2,973,950 | $580,440 |
| 2023 | $41,359 | $3,554,390 | $2,973,950 | $580,440 |
| 2022 | $40,982 | $3,554,390 | $2,973,950 | $580,440 |
| 2021 | $34,595 | $2,873,360 | $2,298,940 | $574,420 |
| 2020 | $34,538 | $2,873,360 | $2,298,940 | $574,420 |
| 2019 | $34,770 | $2,864,050 | $2,298,940 | $565,110 |
| 2018 | $33,996 | $2,864,050 | $2,298,940 | $565,110 |
| 2017 | $34,423 | $2,864,050 | $2,298,940 | $565,110 |
| 2016 | $33,879 | $2,864,050 | $2,298,940 | $565,110 |
| 2015 | $34,474 | $2,890,860 | $2,663,010 | $227,850 |
| 2014 | $33,606 | $2,890,860 | $2,663,010 | $227,850 |
Source: Public Records
Map
Nearby Homes