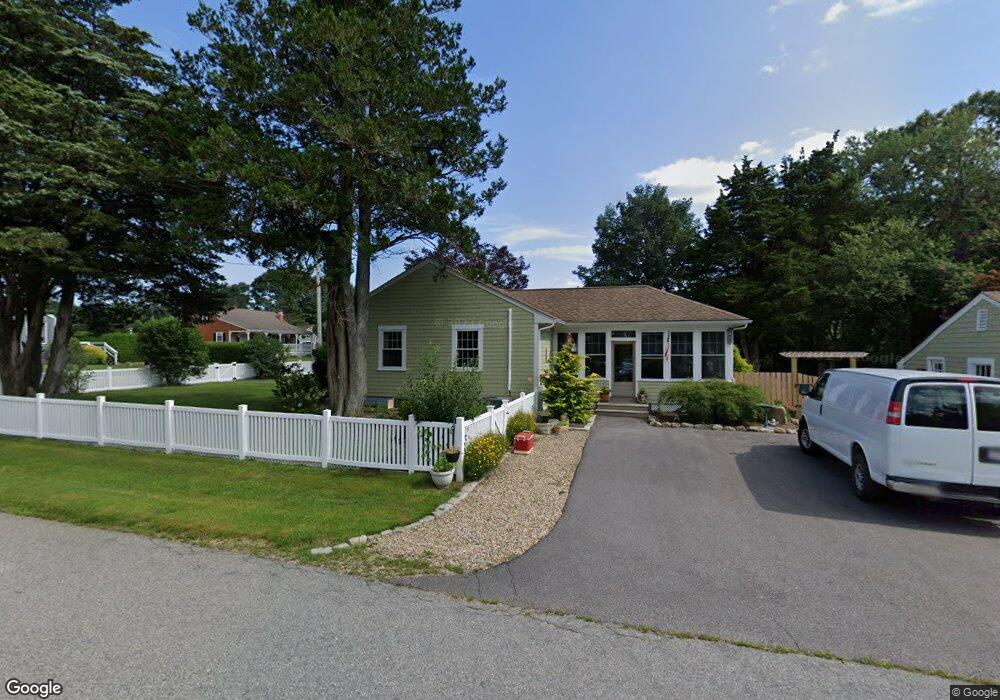
9 Truman St Westport, MA 02790
North Westport NeighborhoodEstimated Value: $448,000 - $520,223
2
Beds
--
Bath
1,320
Sq Ft
$373/Sq Ft
Est. Value
About This Home
This home is located at 9 Truman St, Westport, MA 02790 and is currently estimated at $492,806, approximately $373 per square foot. 9 Truman St is a home located in Bristol County with nearby schools including Alice A. Macomber Primary School, Westport Elementary School, and Westport Middle-High School.
Ownership History
Date
Name
Owned For
Owner Type
Purchase Details
Closed on
Mar 21, 2024
Sold by
Perry James R and Perry Deborah A
Bought by
James R Perry 2024 Irt and Perry
Current Estimated Value
Purchase Details
Closed on
Aug 3, 2006
Sold by
Campbell Dora M
Bought by
Perry Deborah A and Perry James R
Home Financials for this Owner
Home Financials are based on the most recent Mortgage that was taken out on this home.
Original Mortgage
$192,000
Interest Rate
6.7%
Mortgage Type
Purchase Money Mortgage
Create a Home Valuation Report for This Property
The Home Valuation Report is an in-depth analysis detailing your home's value as well as a comparison with similar homes in the area
Home Values in the Area
Average Home Value in this Area
Purchase History
| Date | Buyer | Sale Price | Title Company |
|---|---|---|---|
| James R Perry 2024 Irt | -- | None Available | |
| Perry Deborah A | $240,000 | -- |
Source: Public Records
Mortgage History
| Date | Status | Borrower | Loan Amount |
|---|---|---|---|
| Previous Owner | Perry Deborah A | $192,000 |
Source: Public Records
Tax History Compared to Growth
Tax History
| Year | Tax Paid | Tax Assessment Tax Assessment Total Assessment is a certain percentage of the fair market value that is determined by local assessors to be the total taxable value of land and additions on the property. | Land | Improvement |
|---|---|---|---|---|
| 2025 | $3,090 | $414,700 | $167,000 | $247,700 |
| 2024 | $3,087 | $399,300 | $154,700 | $244,600 |
| 2023 | $2,976 | $364,700 | $141,000 | $223,700 |
| 2022 | $2,716 | $320,300 | $128,200 | $192,100 |
| 2021 | $2,220 | $257,500 | $116,500 | $141,000 |
| 2020 | $2,131 | $252,800 | $111,800 | $141,000 |
| 2019 | $2,058 | $248,900 | $111,800 | $137,100 |
| 2018 | $1,761 | $215,500 | $112,800 | $102,700 |
| 2017 | $1,675 | $210,200 | $109,200 | $101,000 |
| 2016 | $1,599 | $202,100 | $105,600 | $96,500 |
| 2015 | $1,552 | $195,700 | $108,000 | $87,700 |
Source: Public Records
Map
Nearby Homes