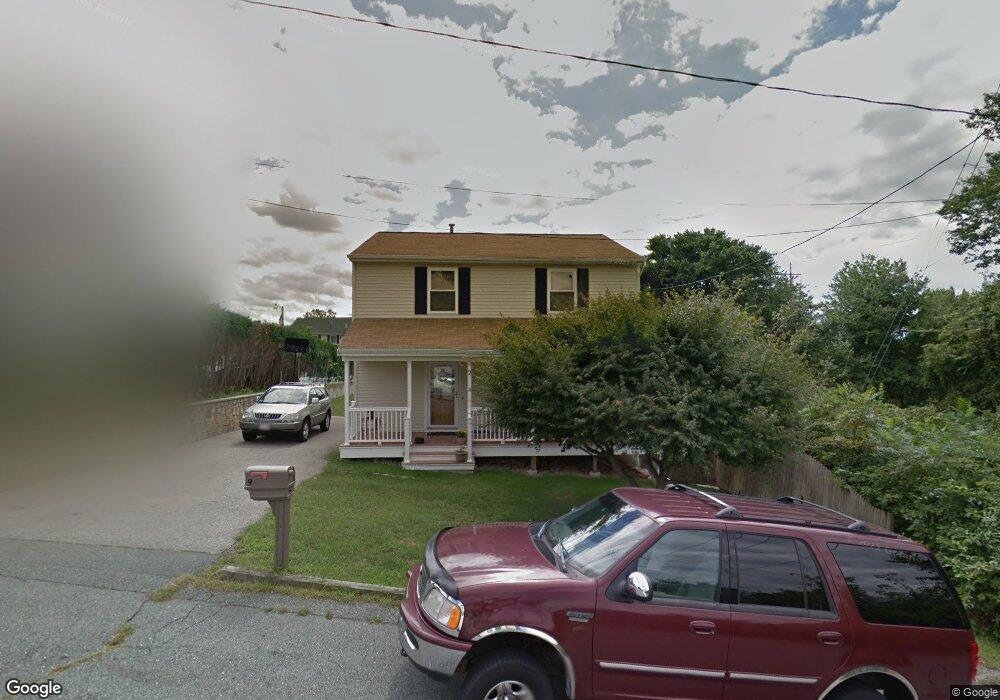
9 Tucker St Fall River, MA 02724
Father Kelly NeighborhoodEstimated Value: $414,270 - $454,000
3
Beds
2
Baths
1,484
Sq Ft
$294/Sq Ft
Est. Value
About This Home
This home is located at 9 Tucker St, Fall River, MA 02724 and is currently estimated at $436,318, approximately $294 per square foot. 9 Tucker St is a home located in Bristol County with nearby schools including Henry Lord Community School, B M C Durfee High School, and Argosy Collegiate Charter School.
Ownership History
Date
Name
Owned For
Owner Type
Purchase Details
Closed on
Oct 29, 2003
Sold by
Gamache Marc P and Gamache Natalie L
Bought by
Gamache Natalie L
Current Estimated Value
Home Financials for this Owner
Home Financials are based on the most recent Mortgage that was taken out on this home.
Original Mortgage
$160,600
Outstanding Balance
$74,713
Interest Rate
6.05%
Mortgage Type
Purchase Money Mortgage
Estimated Equity
$361,605
Purchase Details
Closed on
Jan 14, 1994
Sold by
Demello Victor
Bought by
Gamache Marc P and Gamache Natalie L
Home Financials for this Owner
Home Financials are based on the most recent Mortgage that was taken out on this home.
Original Mortgage
$115,900
Interest Rate
7.22%
Mortgage Type
Purchase Money Mortgage
Purchase Details
Closed on
Aug 6, 1993
Sold by
Dazzeo Sandra
Bought by
Demello Victor
Create a Home Valuation Report for This Property
The Home Valuation Report is an in-depth analysis detailing your home's value as well as a comparison with similar homes in the area
Home Values in the Area
Average Home Value in this Area
Purchase History
| Date | Buyer | Sale Price | Title Company |
|---|---|---|---|
| Gamache Natalie L | -- | -- | |
| Gamache Marc P | $122,000 | -- | |
| Demello Victor | $32,000 | -- |
Source: Public Records
Mortgage History
| Date | Status | Borrower | Loan Amount |
|---|---|---|---|
| Open | Demello Victor | $160,600 | |
| Previous Owner | Demello Victor | $5,000 | |
| Previous Owner | Demello Victor | $115,900 |
Source: Public Records
Tax History
| Year | Tax Paid | Tax Assessment Tax Assessment Total Assessment is a certain percentage of the fair market value that is determined by local assessors to be the total taxable value of land and additions on the property. | Land | Improvement |
|---|---|---|---|---|
| 2025 | $4,009 | $350,100 | $127,200 | $222,900 |
| 2024 | $3,751 | $326,500 | $122,300 | $204,200 |
| 2023 | $3,802 | $309,900 | $104,900 | $205,000 |
| 2022 | $3,358 | $266,100 | $95,300 | $170,800 |
| 2021 | $3,262 | $235,900 | $88,200 | $147,700 |
| 2020 | $3,217 | $222,600 | $84,400 | $138,200 |
| 2019 | $3,103 | $212,800 | $80,400 | $132,400 |
| 2018 | $2,987 | $204,300 | $78,900 | $125,400 |
| 2017 | $2,852 | $203,700 | $80,500 | $123,200 |
| 2016 | $2,725 | $199,900 | $83,900 | $116,000 |
| 2015 | $2,616 | $200,000 | $80,800 | $119,200 |
| 2014 | $2,569 | $204,200 | $85,000 | $119,200 |
Source: Public Records
Map
Nearby Homes
Your Personal Tour Guide
Ask me questions while you tour the home.