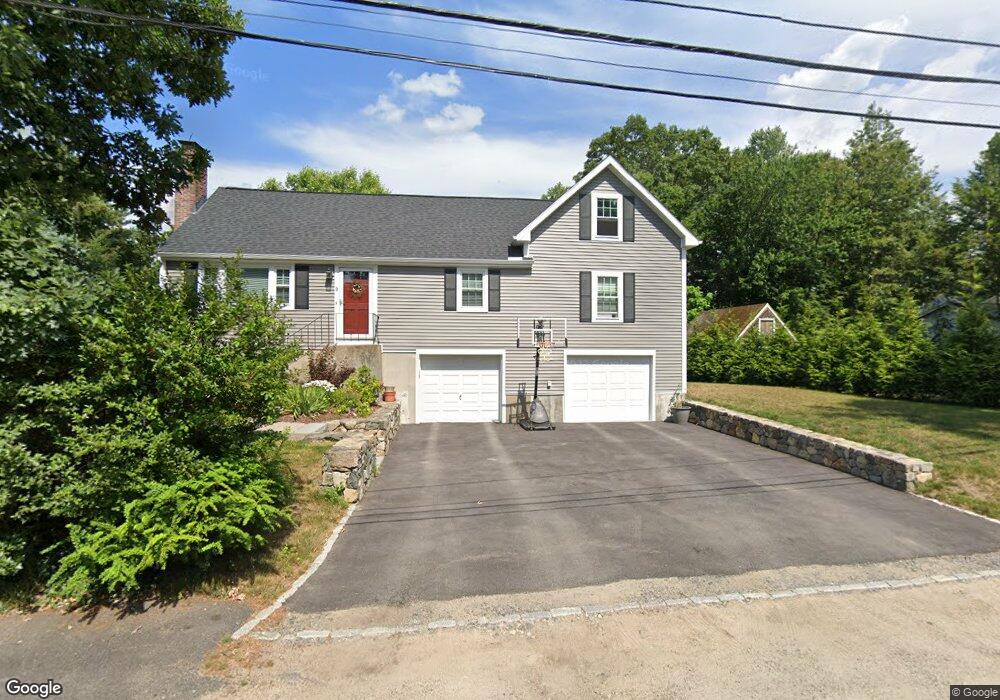
9 Upland Rd Natick, MA 01760
Estimated Value: $682,000 - $932,738
4
Beds
2
Baths
1,428
Sq Ft
$591/Sq Ft
Est. Value
About This Home
This home is located at 9 Upland Rd, Natick, MA 01760 and is currently estimated at $843,685, approximately $590 per square foot. 9 Upland Rd is a home located in Middlesex County with nearby schools including Natick High School, Wilson Middle School, and Bennett-Hemenway (Ben-Hem) Elementary School.
Ownership History
Date
Name
Owned For
Owner Type
Purchase Details
Closed on
Jun 18, 2010
Sold by
Tinkham Norman B and Tinkham Janice P
Bought by
Gans Joseph D and Gans Sara E
Current Estimated Value
Home Financials for this Owner
Home Financials are based on the most recent Mortgage that was taken out on this home.
Original Mortgage
$291,600
Outstanding Balance
$196,005
Interest Rate
5.03%
Mortgage Type
Purchase Money Mortgage
Estimated Equity
$647,680
Create a Home Valuation Report for This Property
The Home Valuation Report is an in-depth analysis detailing your home's value as well as a comparison with similar homes in the area
Home Values in the Area
Average Home Value in this Area
Purchase History
| Date | Buyer | Sale Price | Title Company |
|---|---|---|---|
| Gans Joseph D | $324,000 | -- | |
| Gans Joseph D | $324,000 | -- | |
| Gans Joseph D | $324,000 | -- |
Source: Public Records
Mortgage History
| Date | Status | Borrower | Loan Amount |
|---|---|---|---|
| Open | Gans Joseph D | $291,600 | |
| Closed | Gans Joseph D | $291,600 | |
| Previous Owner | Gans Joseph D | $97,500 | |
| Previous Owner | Gans Joseph D | $99,000 |
Source: Public Records
Tax History
| Year | Tax Paid | Tax Assessment Tax Assessment Total Assessment is a certain percentage of the fair market value that is determined by local assessors to be the total taxable value of land and additions on the property. | Land | Improvement |
|---|---|---|---|---|
| 2025 | $10,160 | $849,500 | $418,600 | $430,900 |
| 2024 | $9,808 | $800,000 | $394,000 | $406,000 |
| 2023 | $9,582 | $758,100 | $379,200 | $378,900 |
| 2022 | $9,266 | $694,600 | $344,800 | $349,800 |
| 2021 | $8,847 | $650,000 | $325,100 | $324,900 |
| 2020 | $6,583 | $483,700 | $310,300 | $173,400 |
| 2019 | $4,601 | $483,700 | $310,300 | $173,400 |
| 2018 | $5,382 | $412,400 | $295,500 | $116,900 |
| 2017 | $4,797 | $355,600 | $251,200 | $104,400 |
| 2016 | $4,512 | $332,500 | $229,100 | $103,400 |
| 2015 | $4,462 | $322,900 | $229,100 | $93,800 |
Source: Public Records
Map
Nearby Homes
- 7 Westwood Rd
- 1 Sunnyside Ave
- 16 Sunnyside Ave
- 8 Oakdale Ave
- 5 Bass Terrace
- 4 Shore Rd
- 26 Longfellow Rd
- 925 Worcester St
- 38 Parker Rd
- 37 Longfellow Rd
- 27 Garrison Rd
- 20 Parker Rd
- 27 Border Rd
- 8 Arlington Cir
- 2 Cavanagh Rd
- 12 Russell Rd Unit 404
- 6 Boulder Brook Rd
- 339 Weston Rd
- 5 Wilde Rd
- 23 Pilgrim Rd
Your Personal Tour Guide
Ask me questions while you tour the home.