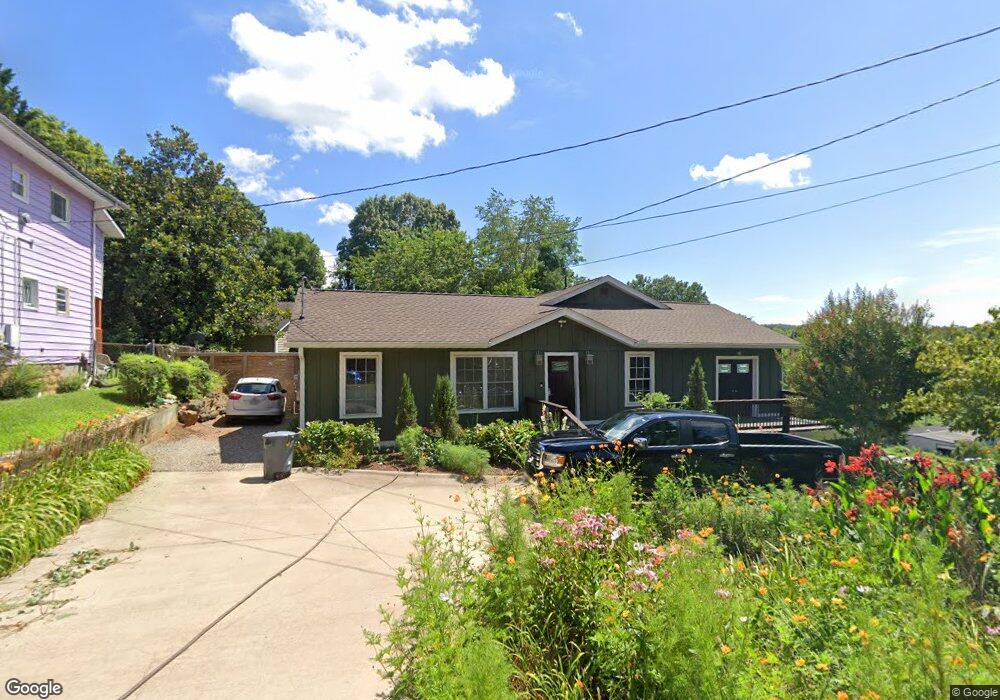
9 Vernell Ave Asheville, NC 28801
South French Broad NeighborhoodEstimated Value: $398,000 - $671,521
3
Beds
3
Baths
1,985
Sq Ft
$296/Sq Ft
Est. Value
About This Home
This home is located at 9 Vernell Ave, Asheville, NC 28801 and is currently estimated at $587,130, approximately $295 per square foot. 9 Vernell Ave is a home located in Buncombe County with nearby schools including Isaac Dickson Elementary, Hall Fletcher Elementary, and Ira B Jones Elementary.
Ownership History
Date
Name
Owned For
Owner Type
Purchase Details
Closed on
Oct 5, 2015
Sold by
Patten Marian
Bought by
Caldwell M Michael
Current Estimated Value
Purchase Details
Closed on
Mar 21, 2006
Sold by
Marvels Walter Lee and Marvels Tanya R
Bought by
Caldwell M Michael
Home Financials for this Owner
Home Financials are based on the most recent Mortgage that was taken out on this home.
Original Mortgage
$139,500
Interest Rate
6.19%
Mortgage Type
Fannie Mae Freddie Mac
Purchase Details
Closed on
Sep 21, 1998
Sold by
Rogers Bradford W and Rogers Shelle S
Bought by
Marvels Walter L and Marvels Terri L
Home Financials for this Owner
Home Financials are based on the most recent Mortgage that was taken out on this home.
Original Mortgage
$67,120
Interest Rate
9.45%
Mortgage Type
Unknown
Purchase Details
Closed on
May 21, 1998
Sold by
Dusenbury John A
Bought by
Rogers Bradford W and Rogers Shelle S
Create a Home Valuation Report for This Property
The Home Valuation Report is an in-depth analysis detailing your home's value as well as a comparison with similar homes in the area
Home Values in the Area
Average Home Value in this Area
Purchase History
| Date | Buyer | Sale Price | Title Company |
|---|---|---|---|
| Caldwell M Michael | $2,000 | None Available | |
| Caldwell M Michael | $155,000 | None Available | |
| Marvels Walter L | $84,000 | -- | |
| Rogers Bradford W | $3,000 | -- |
Source: Public Records
Mortgage History
| Date | Status | Borrower | Loan Amount |
|---|---|---|---|
| Previous Owner | Caldwell M Michael | $139,500 | |
| Previous Owner | Marvels Walter L | $67,120 |
Source: Public Records
Tax History Compared to Growth
Tax History
| Year | Tax Paid | Tax Assessment Tax Assessment Total Assessment is a certain percentage of the fair market value that is determined by local assessors to be the total taxable value of land and additions on the property. | Land | Improvement |
|---|---|---|---|---|
| 2025 | $4,359 | $420,900 | $85,000 | $335,900 |
| 2024 | $4,359 | $420,900 | $85,000 | $335,900 |
| 2023 | $4,359 | $420,900 | $85,000 | $335,900 |
| 2022 | $4,197 | $420,900 | $0 | $0 |
| 2021 | $4,197 | $420,900 | $0 | $0 |
| 2020 | $3,147 | $292,000 | $0 | $0 |
| 2019 | $3,147 | $292,000 | $0 | $0 |
| 2018 | $3,147 | $292,000 | $0 | $0 |
| 2017 | $3,177 | $225,300 | $0 | $0 |
| 2016 | $2,769 | $225,300 | $0 | $0 |
| 2015 | $2,769 | $225,300 | $0 | $0 |
| 2014 | $2,320 | $191,100 | $0 | $0 |
Source: Public Records
Map
Nearby Homes
- 273 S French Broad Ave Unit 3&4
- 289 S French Broad Ave
- 25 Ora St
- 128 Choctaw St
- 138 S French Broad Ave
- 133 S Grove St
- 108 Southside Ave
- 102 Clingman Ave
- 99999 Depot St
- 102 Southside Ave Unit 15
- 243 Short Coxe Ave
- 35 Jefferson Dr
- 22 Pine Grove Ave
- 64 Clingman Ave Unit 207
- 3 Lee Garden Ln Unit 103
- 3 Lee Garden Ln Unit 204
- 3 Lee Garden Ln Unit 105
- 000 Haywood Rd
- 56 Logan Ave
- 0 Haywood Rd
- 7 Vernell Ave
- 5 Vernell Ave
- 279 S French Broad Ave
- 10 Vernell Ave
- 12 Vernell Ave
- 8 Vernell Ave
- 3 Vernell Ave
- 14 Vernell Ave
- 4 Vernell Ave
- 275 S French Broad Ave
- 287 S French Broad Ave
- 271 S French Broad Ave
- 273 S French Broad Ave
- 257 S French Broad Ave
- 253 S French Broad Ave
- 255 S French Broad Ave
- 251 S French Broad Ave
- 293 S French Broad Ave
- 99999 S French Broad Ave Unit 2
- 272 S French Broad Ave