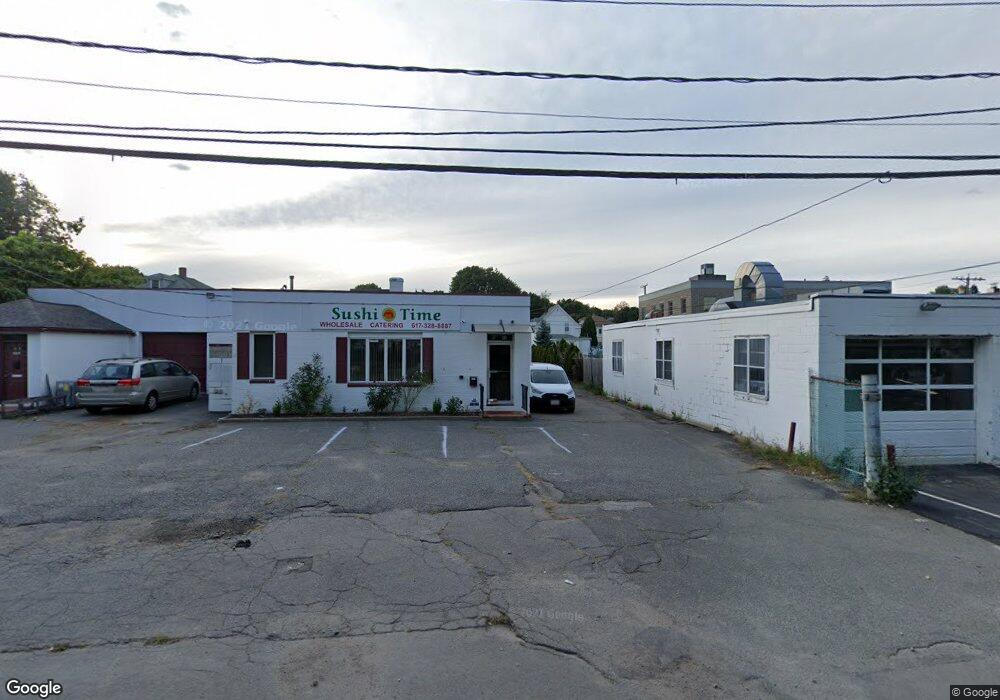
9 Vernon St Quincy, MA 02169
South Quincy NeighborhoodEstimated Value: $1,870,585
--
Bed
2
Baths
10,538
Sq Ft
$178/Sq Ft
Est. Value
About This Home
This home is located at 9 Vernon St, Quincy, MA 02169 and is currently estimated at $1,870,585, approximately $177 per square foot. 9 Vernon St is a home located in Norfolk County with nearby schools including South West Middle School, Lincoln-Hancock Community School, and Quincy High School.
Ownership History
Date
Name
Owned For
Owner Type
Purchase Details
Closed on
Aug 25, 2017
Sold by
Verbranch Llc
Bought by
9 & 15 Vernon Street Llc
Current Estimated Value
Home Financials for this Owner
Home Financials are based on the most recent Mortgage that was taken out on this home.
Original Mortgage
$920,000
Outstanding Balance
$770,933
Interest Rate
4.03%
Mortgage Type
Commercial
Estimated Equity
$1,099,652
Purchase Details
Closed on
Dec 27, 2012
Sold by
Andre Rt
Bought by
Verbranch Llc
Create a Home Valuation Report for This Property
The Home Valuation Report is an in-depth analysis detailing your home's value as well as a comparison with similar homes in the area
Home Values in the Area
Average Home Value in this Area
Purchase History
| Date | Buyer | Sale Price | Title Company |
|---|---|---|---|
| 9 & 15 Vernon Street Llc | $1,150,000 | -- | |
| Verbranch Llc | -- | -- |
Source: Public Records
Mortgage History
| Date | Status | Borrower | Loan Amount |
|---|---|---|---|
| Open | 9 & 15 Vernon Street Llc | $920,000 |
Source: Public Records
Tax History Compared to Growth
Tax History
| Year | Tax Paid | Tax Assessment Tax Assessment Total Assessment is a certain percentage of the fair market value that is determined by local assessors to be the total taxable value of land and additions on the property. | Land | Improvement |
|---|---|---|---|---|
| 2025 | $37,587 | $1,633,500 | $253,500 | $1,380,000 |
| 2024 | $33,426 | $1,488,900 | $251,100 | $1,237,800 |
| 2023 | $29,748 | $1,341,200 | $248,500 | $1,092,700 |
| 2022 | $30,138 | $1,263,100 | $236,700 | $1,026,400 |
| 2021 | $28,742 | $1,186,700 | $234,500 | $952,200 |
| 2020 | $27,197 | $1,094,900 | $232,100 | $862,800 |
| 2019 | $26,958 | $1,070,600 | $229,800 | $840,800 |
| 2018 | $24,277 | $897,800 | $227,600 | $670,200 |
| 2017 | $19,279 | $671,500 | $220,800 | $450,700 |
| 2016 | $19,170 | $652,700 | $220,800 | $431,900 |
| 2015 | $19,672 | $650,100 | $220,800 | $429,300 |
| 2014 | $19,119 | $612,200 | $220,800 | $391,400 |
Source: Public Records
Map
Nearby Homes
- 21 Totman St Unit 202
- 21 Totman St Unit 309
- 21 Totman St Unit Model-1
- 21 Totman St Unit 209
- 21 Totman St Unit 203
- 21 Totman St Unit 2
- 347 Centre St
- 118 Brook Rd Unit 2
- 94 Brook Rd Unit 3
- 56 Penn St Unit 4
- 21 Arthur St
- 91 Garfield St
- 64 Garfield St Unit B
- 14 Arthur Ave
- 12 Arthur Ave
- 57 Buckley St
- 46-48 Buckley St
- 51 Brook Rd
- 72 Federal Ave
- 211 West St Unit 12B
- 11 Vernon St
- 20A Branch St
- 20 Branch St
- 17 Vernon St
- 24 Branch St
- 24 Branch St Unit 2
- 26 Branch St Unit 1
- 253 Centre St
- 17 Branch St Unit 19
- 19 Branch St
- 11 Branch St
- 23 Branch St Unit 3
- 23 Branch St
- 23 Branch St Unit 5
- 243 Centre St
- 27 Branch St
- 269 Centre St
- 38 Branch St
- 22 Albertina St
- 241 Centre St