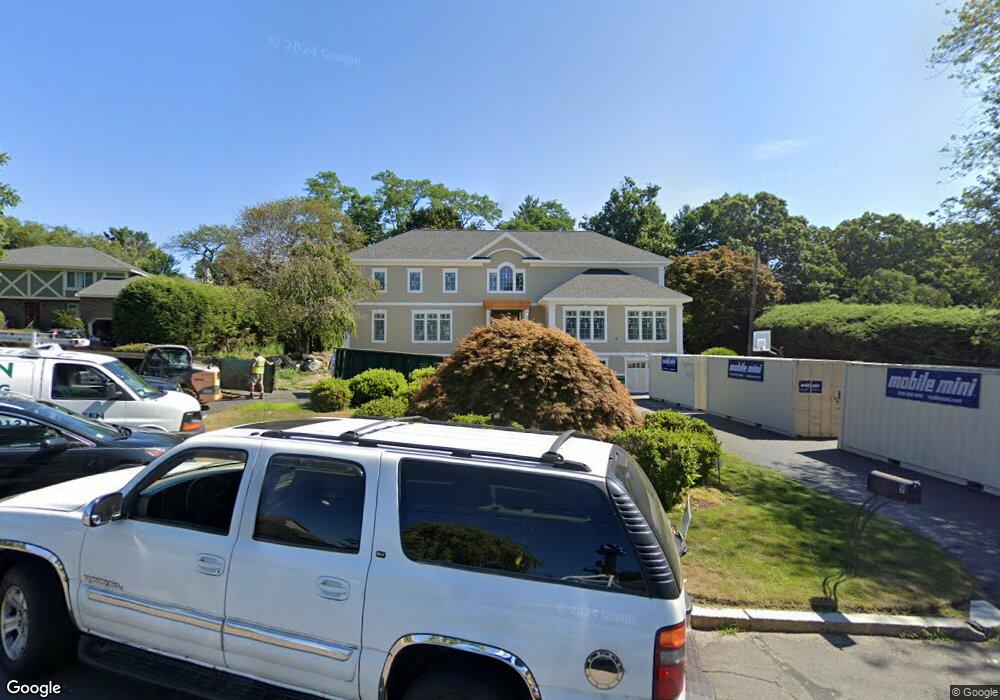
9 Vinson Cir Winchester, MA 01890
West Side NeighborhoodEstimated Value: $2,168,000 - $3,207,000
3
Beds
4
Baths
4,000
Sq Ft
$654/Sq Ft
Est. Value
About This Home
This home is located at 9 Vinson Cir, Winchester, MA 01890 and is currently estimated at $2,616,828, approximately $654 per square foot. 9 Vinson Cir is a home located in Middlesex County with nearby schools including Vinson-Owen Elementary School, McCall Middle School, and Winchester High School.
Ownership History
Date
Name
Owned For
Owner Type
Purchase Details
Closed on
Oct 30, 2008
Sold by
Terzian Robert J
Bought by
Charchaflian Paul J
Current Estimated Value
Home Financials for this Owner
Home Financials are based on the most recent Mortgage that was taken out on this home.
Original Mortgage
$350,000
Interest Rate
5.83%
Mortgage Type
Purchase Money Mortgage
Purchase Details
Closed on
Dec 19, 2005
Sold by
Dallai Riccardo
Bought by
Dallai Anna M and Terzian Robert J
Home Financials for this Owner
Home Financials are based on the most recent Mortgage that was taken out on this home.
Original Mortgage
$970,000
Interest Rate
6.34%
Mortgage Type
Purchase Money Mortgage
Purchase Details
Closed on
Dec 2, 1992
Sold by
Gattineri Jo-Ann and Gattineri Daniel
Bought by
Dallai Riccardo and Dallai Anna M
Create a Home Valuation Report for This Property
The Home Valuation Report is an in-depth analysis detailing your home's value as well as a comparison with similar homes in the area
Home Values in the Area
Average Home Value in this Area
Purchase History
| Date | Buyer | Sale Price | Title Company |
|---|---|---|---|
| Charchaflian Paul J | $889,100 | -- | |
| Dallai Anna M | $1,000,000 | -- | |
| Dallai Riccardo | $515,000 | -- |
Source: Public Records
Mortgage History
| Date | Status | Borrower | Loan Amount |
|---|---|---|---|
| Closed | Dallai Riccardo | $300,000 | |
| Closed | Dallai Riccardo | $350,000 | |
| Closed | Charchaflian Paul J | $350,000 | |
| Previous Owner | Dallai Anna M | $970,000 |
Source: Public Records
Tax History Compared to Growth
Tax History
| Year | Tax Paid | Tax Assessment Tax Assessment Total Assessment is a certain percentage of the fair market value that is determined by local assessors to be the total taxable value of land and additions on the property. | Land | Improvement |
|---|---|---|---|---|
| 2025 | $266 | $2,399,700 | $1,000,900 | $1,398,800 |
| 2024 | $25,140 | $2,218,900 | $920,900 | $1,298,000 |
| 2023 | $23,845 | $2,020,800 | $760,900 | $1,259,900 |
| 2022 | $23,833 | $1,905,100 | $700,800 | $1,204,300 |
| 2021 | $23,159 | $1,805,100 | $600,800 | $1,204,300 |
| 2020 | $17,889 | $1,443,800 | $600,800 | $843,000 |
| 2019 | $12,659 | $1,045,300 | $560,800 | $484,500 |
| 2018 | $12,057 | $989,100 | $515,800 | $473,300 |
| 2017 | $12,254 | $997,900 | $515,800 | $482,100 |
| 2016 | $11,255 | $963,600 | $515,800 | $447,800 |
| 2015 | $10,897 | $897,600 | $449,800 | $447,800 |
| 2014 | $10,921 | $862,600 | $430,800 | $431,800 |
Source: Public Records
Map
Nearby Homes
- 7 Thornberry Rd
- 41 Squire Rd
- 26 Berkshire Dr
- 20 Amberwood Dr
- 19 Cox Rd
- 5 Azalea Rd
- 14 Nassau Dr
- 257 High St
- 189 High St
- 19 Gershon Way Unit 1
- 19 Gershon Way
- 276 High St
- 7 Grace Rd
- 16 Winning Farm Rd Unit 16
- 139 High St
- 21 Derby Dr Unit 21
- 30 Whipple Rd
- 22 Tyler Rd
- 7 Wainwright Rd Unit 118
- 500 Lexington St Unit 6