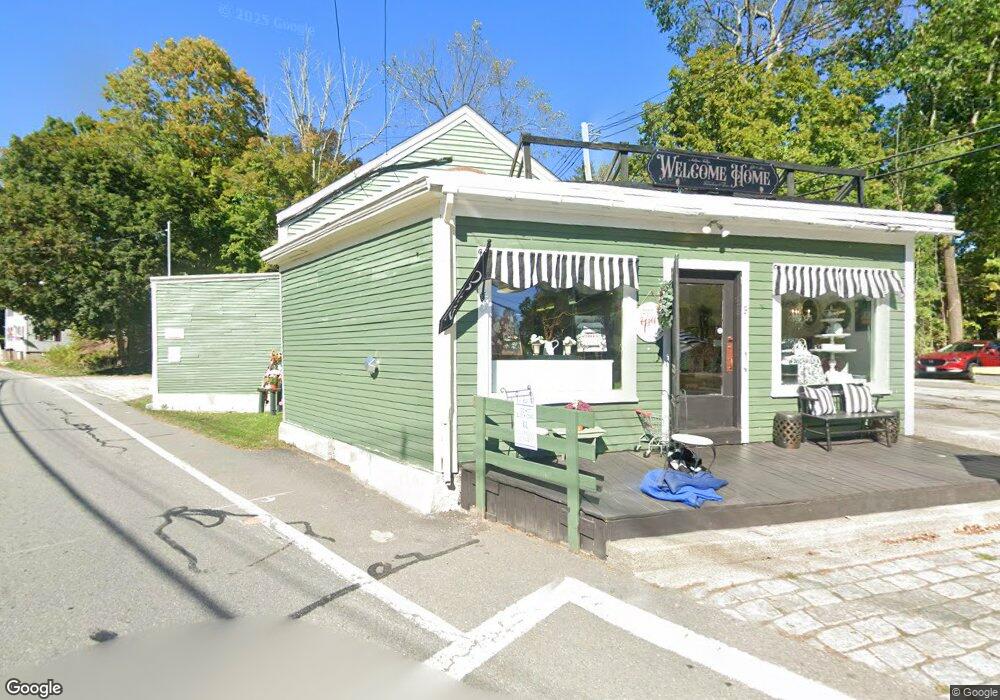
9 W Main St Groton, MA 01450
Estimated Value: $332,266
Studio
2
Baths
2,716
Sq Ft
$122/Sq Ft
Est. Value
About This Home
This home is located at 9 W Main St, Groton, MA 01450 and is currently estimated at $332,266, approximately $122 per square foot. 9 W Main St is a home located in Middlesex County with nearby schools including Groton Dunstable Regional High School, Groton Community School, and Seven Hills At Groton.
Ownership History
Date
Name
Owned For
Owner Type
Purchase Details
Closed on
Apr 19, 2018
Sold by
Shea Janet M
Bought by
Leung Kent
Current Estimated Value
Home Financials for this Owner
Home Financials are based on the most recent Mortgage that was taken out on this home.
Original Mortgage
$20,000
Outstanding Balance
$17,208
Interest Rate
4.46%
Mortgage Type
New Conventional
Estimated Equity
$315,058
Purchase Details
Closed on
Jul 6, 2012
Sold by
9 W Main Props Rt and Hurst
Bought by
Groton Town Of
Home Financials for this Owner
Home Financials are based on the most recent Mortgage that was taken out on this home.
Original Mortgage
$100,000
Interest Rate
3.78%
Mortgage Type
Commercial
Purchase Details
Closed on
Jul 3, 2012
Sold by
9 W Main Props Rt and Hurst
Bought by
Shea Janet M
Home Financials for this Owner
Home Financials are based on the most recent Mortgage that was taken out on this home.
Original Mortgage
$100,000
Interest Rate
3.78%
Mortgage Type
Commercial
Purchase Details
Closed on
Jan 2, 2007
Sold by
Sherwin Winthrop W
Bought by
9 W Main Prop Rt and Hurst
Create a Home Valuation Report for This Property
The Home Valuation Report is an in-depth analysis detailing your home's value as well as a comparison with similar homes in the area
Home Values in the Area
Average Home Value in this Area
Purchase History
| Date | Buyer | Sale Price | Title Company |
|---|---|---|---|
| Leung Kent | $200,000 | -- | |
| Leung Kent | $200,000 | -- | |
| Leung Kent | $200,000 | -- | |
| Groton Town Of | $4,089 | -- | |
| Groton Town Of | $4,089 | -- | |
| Groton Town Of | $4,089 | -- | |
| Shea Janet M | $275,000 | -- | |
| Shea Janet M | $275,000 | -- | |
| Shea Janet M | $275,000 | -- | |
| 9 W Main Prop Rt | $250,000 | -- | |
| 9 W Main Prop Rt | $250,000 | -- |
Source: Public Records
Mortgage History
| Date | Status | Borrower | Loan Amount |
|---|---|---|---|
| Open | Leung Kent | $20,000 | |
| Closed | Leung Kent | $20,000 | |
| Previous Owner | Shea Janet M | $100,000 |
Source: Public Records
Tax History
| Year | Tax Paid | Tax Assessment Tax Assessment Total Assessment is a certain percentage of the fair market value that is determined by local assessors to be the total taxable value of land and additions on the property. | Land | Improvement |
|---|---|---|---|---|
| 2025 | $5,742 | $376,500 | $126,500 | $250,000 |
| 2024 | $5,505 | $364,800 | $126,500 | $238,300 |
| 2023 | $5,705 | $364,800 | $126,500 | $238,300 |
| 2022 | $5,104 | $296,900 | $113,300 | $183,600 |
| 2021 | $4,833 | $274,600 | $102,700 | $171,900 |
| 2020 | $4,773 | $274,600 | $102,700 | $171,900 |
| 2019 | $4,966 | $274,200 | $102,700 | $171,500 |
| 2018 | $5,119 | $274,200 | $102,700 | $171,500 |
| 2017 | $5,007 | $274,200 | $102,700 | $171,500 |
| 2016 | $5,114 | $272,300 | $102,700 | $169,600 |
| 2015 | $4,975 | $272,300 | $102,700 | $169,600 |
Source: Public Records
Map
Nearby Homes
- 44 Squannacook Rd
- 8 Bradley Dr Unit A
- 26 Bradley Dr Unit D
- 15 Hayes Woods Ln
- 92 Squannacook Rd
- 43 Longley Rd
- 111 Squannacook Rd
- Lot 3 Maple Ave
- 26 Bluebird Ln
- 105 Townsend Rd Unit 1
- 24 Townsend Rd
- 17 Longley Rd
- 22 Townsend Rd
- Lot 5 Townsend Rd
- 53 Throne Hill Rd
- 9 Spaulding Rd
- 104 Mill St
- 124 Hazen Rd
- 21 Magnolia Ln
- 111 Farmers Row
- 3 W Main St
- 13 Pepperell Rd
- Lot 5 Amelia Way
- Lot 4 Amelia Way
- Lot 7 Amelia Way
- LOT 1 Pepperell Rd
- LOT 1 Townsend Rd
- 16 Townsend Rd
- 2 Pepperell Rd
- 13 W Main St
- 13 W Main St Unit 2
- 17 Pepperell Rd
- 0 Townsend Rd
- 18 Pepperell Rd
- 0 Pepperell Rd
- MAP103 Kemp St
- 19 Pepperell Rd
- 17 W Main St Unit 19
- 17 W Main St Unit 1
- 19 W Main St Unit 2
Your Personal Tour Guide
Ask me questions while you tour the home.