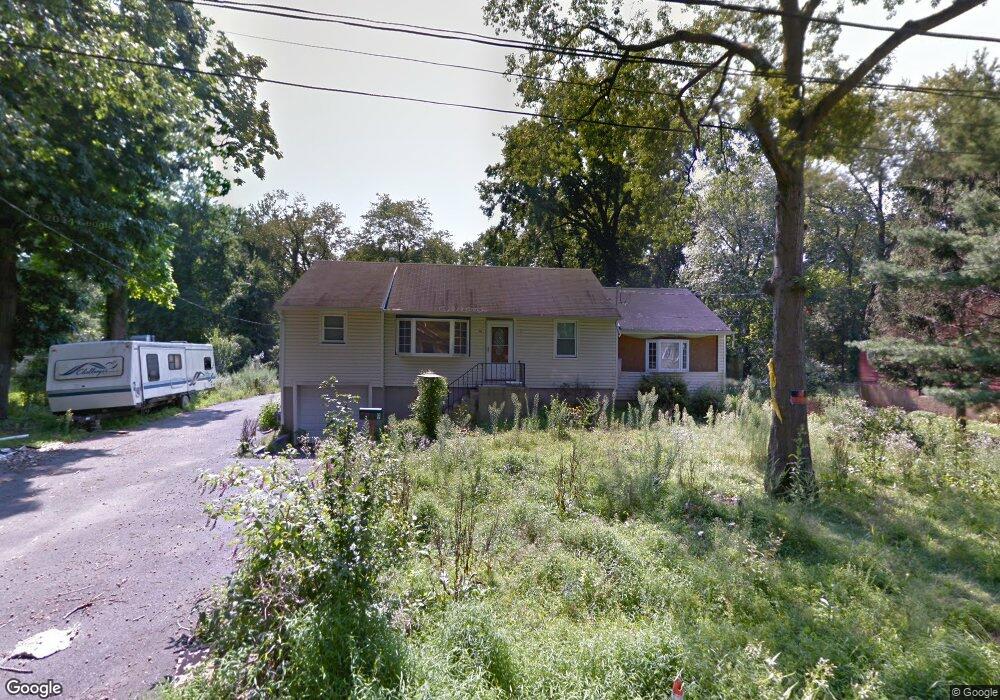
9 Walnut St Lincoln Park, NJ 07035
Estimated Value: $419,097
--
Bed
--
Bath
1,228
Sq Ft
$341/Sq Ft
Est. Value
About This Home
This home is located at 9 Walnut St, Lincoln Park, NJ 07035 and is currently priced at $419,097, approximately $341 per square foot. 9 Walnut St is a home located in Morris County with nearby schools including Lincoln Park Elementary School, Lincoln Park Middle School, and Chapel Hill Academy.
Ownership History
Date
Name
Owned For
Owner Type
Purchase Details
Closed on
Jun 5, 2015
Sold by
Marynowski Stephanie H
Bought by
Borough Of Lincoln Park
Current Estimated Value
Purchase Details
Closed on
Nov 10, 2010
Sold by
Buschman William L and Buschman Dorothy L
Bought by
Delaney Joan
Home Financials for this Owner
Home Financials are based on the most recent Mortgage that was taken out on this home.
Original Mortgage
$146,000
Interest Rate
3.87%
Mortgage Type
New Conventional
Purchase Details
Closed on
Aug 7, 2009
Sold by
Buschmann William L
Bought by
Buschmann William L and Buschmann Dorothy L
Create a Home Valuation Report for This Property
The Home Valuation Report is an in-depth analysis detailing your home's value as well as a comparison with similar homes in the area
Home Values in the Area
Average Home Value in this Area
Purchase History
| Date | Buyer | Sale Price | Title Company |
|---|---|---|---|
| Borough Of Lincoln Park | $265,000 | Attorney | |
| Delaney Joan | $182,500 | Fidelity Natl Title Ins Co | |
| Buschmann William L | -- | None Available |
Source: Public Records
Mortgage History
| Date | Status | Borrower | Loan Amount |
|---|---|---|---|
| Previous Owner | Delaney Joan | $146,000 |
Source: Public Records
Tax History Compared to Growth
Tax History
| Year | Tax Paid | Tax Assessment Tax Assessment Total Assessment is a certain percentage of the fair market value that is determined by local assessors to be the total taxable value of land and additions on the property. | Land | Improvement |
|---|---|---|---|---|
| 2025 | -- | $150,500 | $150,500 | -- |
| 2024 | -- | $131,700 | $131,700 | -- |
| 2023 | -- | $101,100 | $101,100 | $0 |
| 2022 | -- | $101,100 | $101,100 | $0 |
| 2021 | $0 | $101,100 | $101,100 | $0 |
| 2020 | $0 | $101,100 | $101,100 | $0 |
| 2019 | $4,882 | $101,100 | $101,100 | $0 |
| 2018 | $0 | $101,100 | $101,100 | $0 |
| 2017 | $5,269 | $101,100 | $101,100 | $0 |
| 2016 | $5,269 | $206,300 | $101,100 | $105,200 |
| 2015 | $5,269 | $206,300 | $101,100 | $105,200 |
| 2014 | $5,155 | $206,300 | $101,100 | $105,200 |
Source: Public Records
Map
Nearby Homes