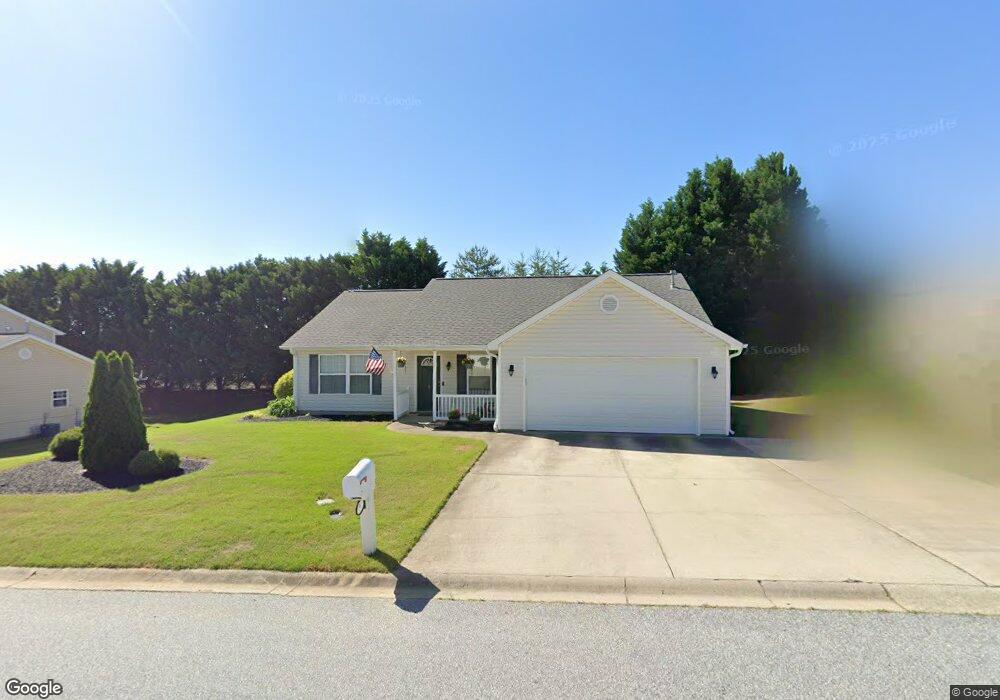
9 Waukegan Way Taylors, SC 29687
Estimated Value: $265,000 - $297,000
3
Beds
2
Baths
1,390
Sq Ft
$205/Sq Ft
Est. Value
About This Home
This home is located at 9 Waukegan Way, Taylors, SC 29687 and is currently estimated at $285,617, approximately $205 per square foot. 9 Waukegan Way is a home located in Greenville County with nearby schools including Taylors Elementary School, Sevier Middle, and Wade Hampton High.
Ownership History
Date
Name
Owned For
Owner Type
Purchase Details
Closed on
Nov 9, 2015
Sold by
Allamon Janie and Hay Kenneth
Bought by
Miller Pamela R and Miller Charles R
Current Estimated Value
Home Financials for this Owner
Home Financials are based on the most recent Mortgage that was taken out on this home.
Original Mortgage
$125,910
Outstanding Balance
$99,001
Interest Rate
3.78%
Mortgage Type
New Conventional
Estimated Equity
$186,616
Purchase Details
Closed on
May 13, 2010
Sold by
Federal Home Loan Mortgage Corporation
Bought by
Allamon Janie
Purchase Details
Closed on
Apr 27, 2010
Sold by
Rodriguez Alba and Rodriguez Roberto
Bought by
Federal Home Loan Mortgage Corp
Purchase Details
Closed on
Apr 6, 2006
Sold by
Aho Homes Llc
Bought by
Rogriguez Roberto and Rodriguez Alba
Home Financials for this Owner
Home Financials are based on the most recent Mortgage that was taken out on this home.
Original Mortgage
$120,200
Interest Rate
6.29%
Mortgage Type
Purchase Money Mortgage
Create a Home Valuation Report for This Property
The Home Valuation Report is an in-depth analysis detailing your home's value as well as a comparison with similar homes in the area
Home Values in the Area
Average Home Value in this Area
Purchase History
| Date | Buyer | Sale Price | Title Company |
|---|---|---|---|
| Miller Pamela R | $139,900 | None Available | |
| Allamon Janie | $118,600 | -- | |
| Federal Home Loan Mortgage Corp | $2,500 | -- | |
| Rogriguez Roberto | $133,800 | None Available |
Source: Public Records
Mortgage History
| Date | Status | Borrower | Loan Amount |
|---|---|---|---|
| Open | Miller Pamela R | $125,910 | |
| Previous Owner | Rogriguez Roberto | $120,200 |
Source: Public Records
Tax History Compared to Growth
Tax History
| Year | Tax Paid | Tax Assessment Tax Assessment Total Assessment is a certain percentage of the fair market value that is determined by local assessors to be the total taxable value of land and additions on the property. | Land | Improvement |
|---|---|---|---|---|
| 2024 | $1,002 | $5,780 | $1,040 | $4,740 |
| 2023 | $1,002 | $5,780 | $1,040 | $4,740 |
| 2022 | $930 | $5,780 | $1,040 | $4,740 |
| 2021 | $1,018 | $5,780 | $1,040 | $4,740 |
| 2020 | $1,014 | $5,470 | $900 | $4,570 |
| 2019 | $1,003 | $5,470 | $900 | $4,570 |
| 2018 | $987 | $5,470 | $900 | $4,570 |
| 2017 | $975 | $5,470 | $900 | $4,570 |
| 2016 | $1,202 | $136,830 | $22,500 | $114,330 |
| 2015 | $905 | $110,500 | $22,500 | $88,000 |
| 2014 | $877 | $109,850 | $22,500 | $87,350 |
Source: Public Records
Map
Nearby Homes
- 106 Sturgeon Bay Dr
- 2 Robinson Rd
- 10 Calalla Ct
- 85 Robinson Rd
- 135 Chick Springs Rd
- 8 Gentian Ct
- 99 River Park Ln
- 402 Lily Pond Ln
- 205 Sandwort Ln
- 705 Hayden Ct
- 109 Twinflower Dr
- 311 Wood Rd
- 3 Bass Way
- 406 Crescentwood Ct
- 421 Wood Rd
- 8 Octavia Rd
- 206 Lincoln Hill Rd
- 114 Casa Loma Dr
- 270 L-Pd-65
- 113 Lincoln Hill Rd
- 5 Waukegan Way
- 15 Waukegan Way
- 20 Waukegan Way
- 28 Waukegan Way
- 1 Waukegan Way
- 16 Rolling River Way Unit 16
- 23 Waukegan Way
- 14 Rolling River Way Unit 14 Rolling River
- 513 Saint Mark Rd
- 501 Saint Mark Rd
- 27 Waukegan Way
- 30 Rolling River Way
- 30 Rolling River Way Unit 30 Rolling River Way
- 515 Saint Mark Rd
- 515 St Mark Rd
- 23 Rolling River Way Unit 23 Rolling River Way
- 11 Rolling River Way Unit 11
- 31 Waukegan Way
- 209 Mountain Gap Rd Unit 209 Mountain Gap
- 36 Waukegan Way