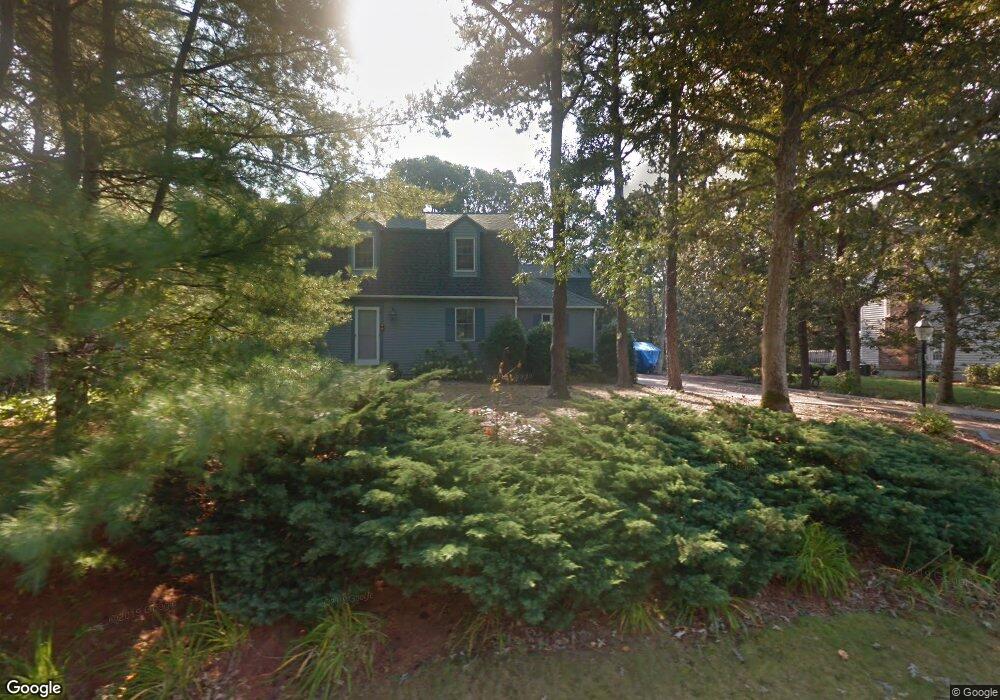
9 Webster St North Falmouth, MA 02556
North Falmouth NeighborhoodEstimated Value: $1,252,000 - $1,511,000
3
Beds
3
Baths
2,072
Sq Ft
$686/Sq Ft
Est. Value
About This Home
This home is located at 9 Webster St, North Falmouth, MA 02556 and is currently estimated at $1,420,789, approximately $685 per square foot. 9 Webster St is a home located in Barnstable County with nearby schools including North Falmouth Elementary School, Morse Pond School, and Lawrence School.
Ownership History
Date
Name
Owned For
Owner Type
Purchase Details
Closed on
Aug 10, 2015
Sold by
Karys Peter and Karys Mary C
Bought by
Karys Rt and Karys
Current Estimated Value
Purchase Details
Closed on
Apr 21, 2011
Sold by
Bezreh-Falmouth Rt and Bezreh
Bought by
Karys Peter and Karys Mary C
Home Financials for this Owner
Home Financials are based on the most recent Mortgage that was taken out on this home.
Original Mortgage
$440,000
Interest Rate
4.9%
Mortgage Type
Purchase Money Mortgage
Create a Home Valuation Report for This Property
The Home Valuation Report is an in-depth analysis detailing your home's value as well as a comparison with similar homes in the area
Home Values in the Area
Average Home Value in this Area
Purchase History
| Date | Buyer | Sale Price | Title Company |
|---|---|---|---|
| Karys Rt | -- | -- | |
| Karys Peter | $550,000 | -- |
Source: Public Records
Mortgage History
| Date | Status | Borrower | Loan Amount |
|---|---|---|---|
| Previous Owner | Karys Peter | $440,000 |
Source: Public Records
Tax History Compared to Growth
Tax History
| Year | Tax Paid | Tax Assessment Tax Assessment Total Assessment is a certain percentage of the fair market value that is determined by local assessors to be the total taxable value of land and additions on the property. | Land | Improvement |
|---|---|---|---|---|
| 2025 | $7,856 | $1,338,300 | $486,000 | $852,300 |
| 2024 | $7,517 | $1,197,000 | $421,900 | $775,100 |
| 2023 | $6,921 | $1,000,200 | $351,600 | $648,600 |
| 2022 | $6,677 | $829,400 | $299,800 | $529,600 |
| 2021 | $6,526 | $767,800 | $299,800 | $468,000 |
| 2020 | $5,004 | $582,500 | $272,500 | $310,000 |
| 2019 | $4,979 | $581,700 | $272,500 | $309,200 |
| 2018 | $4,845 | $563,400 | $272,500 | $290,900 |
| 2017 | $4,710 | $552,200 | $272,500 | $279,700 |
| 2016 | $4,622 | $552,200 | $272,500 | $279,700 |
| 2015 | $4,523 | $552,200 | $272,500 | $279,700 |
| 2014 | $4,448 | $545,800 | $272,600 | $273,200 |
Source: Public Records
Map
Nearby Homes
- 345 Quaker Rd
- 0 Quaker Rd Unit 22504204
- 0 Quaker Rd Unit 73423088
- 104 Streeter Hill Rd
- 104 Streeter Hill Rd
- 121 Streeter Hill Rd
- 121 Streeter Hill Rd
- 213 N Falmouth Hwy Unit 5A
- 213 N Falmouth Hwy Unit 5B
- 213 N Falmouth Hwy Unit 5 A
- 7 Pilgrim Path
- 22 Acorn Dr
- 908 W Falmouth Hwy
- 850 W Falmouth Hwy Unit 11
- 37 Nemasket Rd
- 37 Nemsaket Rd
- 267 N Falmouth Hwy
- 38 Nemasket Rd
- 106 Ambleside Dr
- 74 Hillside Ave