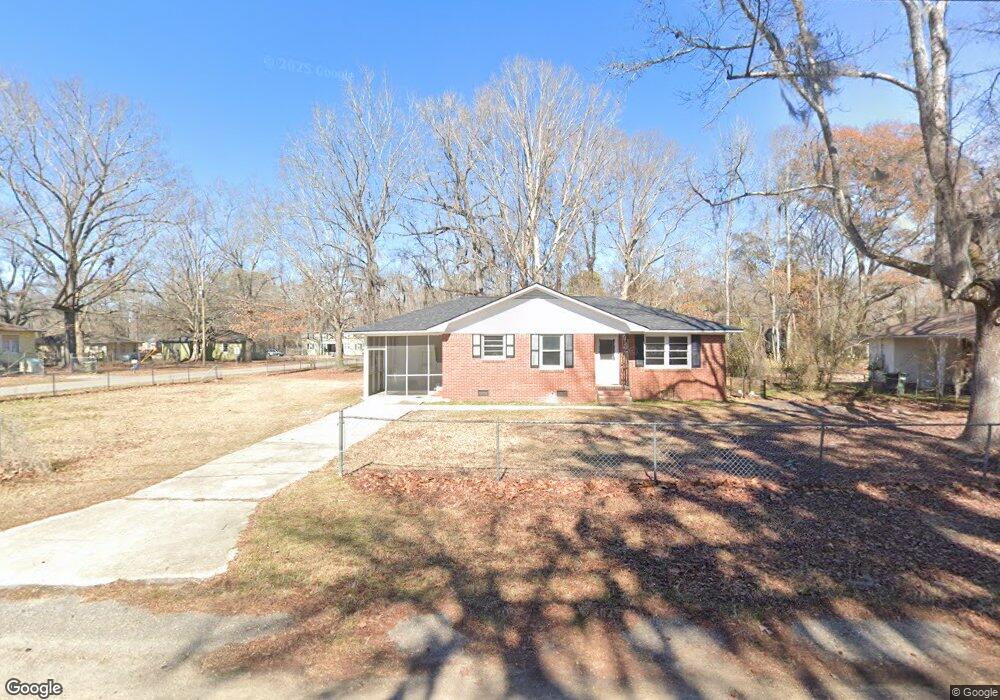
9 Wen-Le Ct E Sumter, SC 29150
Loring NeighborhoodEstimated Value: $159,000 - $174,000
3
Beds
2
Baths
1,144
Sq Ft
$146/Sq Ft
Est. Value
About This Home
This home is located at 9 Wen-Le Ct E, Sumter, SC 29150 and is currently estimated at $166,531, approximately $145 per square foot. 9 Wen-Le Ct E is a home located in Sumter County with nearby schools including Crosswell Drive Elementary School, Chestnut Oaks Middle School, and Sumter High School.
Ownership History
Date
Name
Owned For
Owner Type
Purchase Details
Closed on
Mar 19, 2018
Sold by
Jefferson Zona and Jaylin S Trust
Bought by
Jaylin S Properties Llc
Current Estimated Value
Purchase Details
Closed on
Jun 30, 2017
Sold by
Jefferson Yolanda
Bought by
Jaylin S Trust
Purchase Details
Closed on
May 21, 2013
Sold by
U S Bank National Association
Bought by
Concept Llc
Purchase Details
Closed on
Apr 10, 2006
Sold by
Herlong Donnie and Herlong Susann D
Bought by
Blanding James E
Home Financials for this Owner
Home Financials are based on the most recent Mortgage that was taken out on this home.
Original Mortgage
$14,200
Interest Rate
5.94%
Mortgage Type
Future Advance Clause Open End Mortgage
Purchase Details
Closed on
Jan 11, 2005
Sold by
Ward Buddy K
Bought by
Herlong Donnie and Herlong Susann D
Home Financials for this Owner
Home Financials are based on the most recent Mortgage that was taken out on this home.
Original Mortgage
$43,200
Interest Rate
5.62%
Mortgage Type
New Conventional
Create a Home Valuation Report for This Property
The Home Valuation Report is an in-depth analysis detailing your home's value as well as a comparison with similar homes in the area
Home Values in the Area
Average Home Value in this Area
Purchase History
| Date | Buyer | Sale Price | Title Company |
|---|---|---|---|
| Jaylin S Properties Llc | -- | None Available | |
| Jaylin S Trust | -- | None Available | |
| Concept Llc | $16,000 | -- | |
| Blanding James E | $71,000 | None Available | |
| Herlong Donnie | $104,000 | -- |
Source: Public Records
Mortgage History
| Date | Status | Borrower | Loan Amount |
|---|---|---|---|
| Previous Owner | Blanding James E | $14,200 | |
| Previous Owner | Herlong Donnie | $43,200 |
Source: Public Records
Tax History
| Year | Tax Paid | Tax Assessment Tax Assessment Total Assessment is a certain percentage of the fair market value that is determined by local assessors to be the total taxable value of land and additions on the property. | Land | Improvement |
|---|---|---|---|---|
| 2025 | $1,002 | $2,540 | $360 | $2,180 |
| 2024 | $1,002 | $2,540 | $360 | $2,180 |
| 2023 | $1,002 | $2,540 | $360 | $2,180 |
| 2022 | $993 | $2,540 | $360 | $2,180 |
| 2021 | $936 | $2,540 | $360 | $2,180 |
| 2020 | $936 | $2,330 | $360 | $1,970 |
| 2019 | $930 | $2,330 | $360 | $1,970 |
| 2018 | $922 | $2,300 | $360 | $1,940 |
| 2017 | $938 | $2,330 | $360 | $1,970 |
| 2016 | $926 | $2,330 | $360 | $1,970 |
| 2015 | $957 | $2,460 | $430 | $2,030 |
| 2014 | $957 | $2,460 | $430 | $2,030 |
| 2013 | -- | $2,490 | $430 | $2,060 |
Source: Public Records
Map
Nearby Homes
- 9 Wen Le Ct E
- 428 Robney Dr
- 420 Dogwood Dr
- 468 Loring Dr
- 102 Oswego Hwy
- 106 Oswego Hwy
- 502 Dogwood Dr
- 25 Baker St
- 34 Baker St
- 735 E Charlotte Ave
- 3 Warren Ct
- 52 Wilson St
- 15 Warren Ct
- 761(767) N Main St
- 519 N Main St
- 113 Poinsett Dr
- 120 E Liberty St
- 110 Phifer St
- 2350 Daylilly St Unit Lot 161
- 2370 Daylilly St Unit Lot 159
Your Personal Tour Guide
Ask me questions while you tour the home.