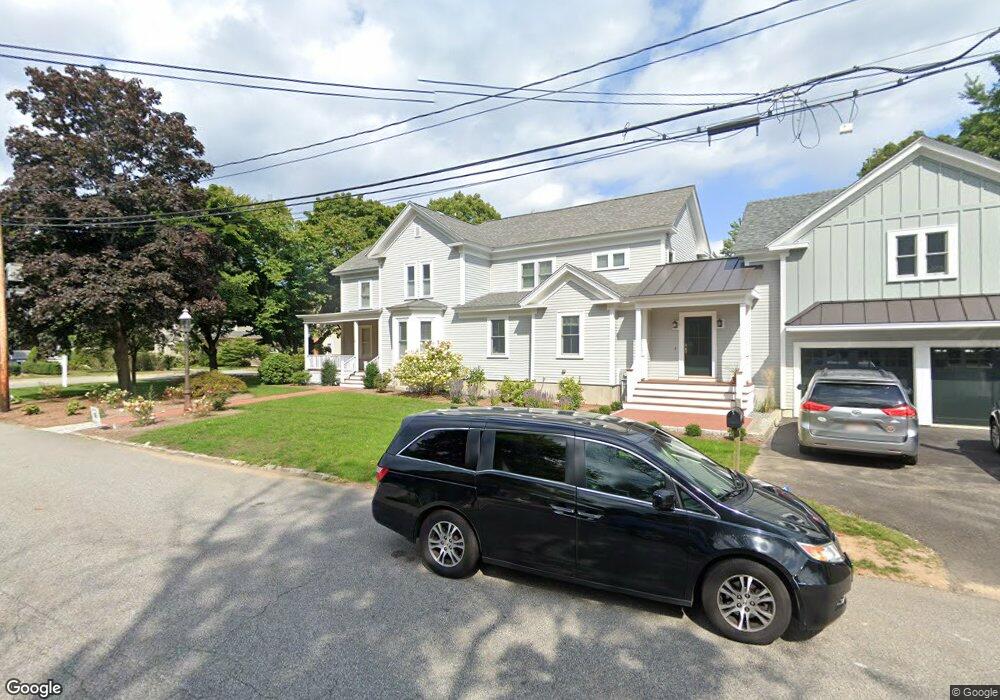
9 West St Concord, MA 01742
Estimated Value: $1,653,000 - $2,011,278
4
Beds
3
Baths
2,600
Sq Ft
$734/Sq Ft
Est. Value
About This Home
This home is located at 9 West St, Concord, MA 01742 and is currently estimated at $1,908,570, approximately $734 per square foot. 9 West St is a home located in Middlesex County with nearby schools including Thoreau Elementary School, Concord Middle School, and Concord Carlisle High School.
Ownership History
Date
Name
Owned For
Owner Type
Purchase Details
Closed on
Mar 20, 2025
Sold by
Deangelis Andrew M and Deangelis Tamara
Bought by
Tamara Deangelis Ret and Deangelis
Current Estimated Value
Purchase Details
Closed on
May 2, 2008
Sold by
Vanessa C W Febbo T C and Vanessa Febbo
Bought by
Deangelis Andrew M and Rork Tamara
Purchase Details
Closed on
Jul 17, 2003
Sold by
Melbin Julie A and Kustin David L
Bought by
Febbo William J
Purchase Details
Closed on
Aug 26, 1997
Sold by
Reid Mark J and Reid Katherine T
Bought by
Melbin Julie A and Kustin David L
Create a Home Valuation Report for This Property
The Home Valuation Report is an in-depth analysis detailing your home's value as well as a comparison with similar homes in the area
Home Values in the Area
Average Home Value in this Area
Purchase History
| Date | Buyer | Sale Price | Title Company |
|---|---|---|---|
| Tamara Deangelis Ret | -- | None Available | |
| Tamara Deangelis Ret | -- | None Available | |
| Deangelis Andrew M | $763,250 | -- | |
| Deangelis Andrew M | $763,250 | -- | |
| Febbo William J | $665,000 | -- | |
| Febbo William J | $665,000 | -- | |
| Melbin Julie A | $390,500 | -- |
Source: Public Records
Mortgage History
| Date | Status | Borrower | Loan Amount |
|---|---|---|---|
| Previous Owner | Melbin Julie A | $822,645 | |
| Previous Owner | Melbin Julie A | $825,000 | |
| Previous Owner | Melbin Julie A | $404,500 |
Source: Public Records
Tax History
| Year | Tax Paid | Tax Assessment Tax Assessment Total Assessment is a certain percentage of the fair market value that is determined by local assessors to be the total taxable value of land and additions on the property. | Land | Improvement |
|---|---|---|---|---|
| 2025 | $24,017 | $1,811,200 | $485,100 | $1,326,100 |
| 2024 | $23,125 | $1,761,200 | $485,100 | $1,276,100 |
| 2023 | $19,342 | $1,492,400 | $441,000 | $1,051,400 |
| 2022 | $22,201 | $1,504,100 | $352,800 | $1,151,300 |
| 2021 | $20,515 | $1,393,700 | $352,800 | $1,040,900 |
| 2020 | $19,723 | $1,386,000 | $352,800 | $1,033,200 |
| 2019 | $16,029 | $1,129,600 | $364,500 | $765,100 |
| 2018 | $14,579 | $1,020,200 | $334,500 | $685,700 |
| 2017 | $14,315 | $1,017,400 | $310,600 | $706,800 |
| 2016 | $13,786 | $990,400 | $310,600 | $679,800 |
| 2015 | $12,861 | $900,000 | $287,700 | $612,300 |
Source: Public Records
Map
Nearby Homes
- 70 McCallar Ln
- 111 Central St
- 54 Maple St
- 22 Center Village Dr
- 95 Conant St Unit 320
- 42 Sunnyside Ln
- 47 Bridgecourt Ln
- 45 Millrun Ln Unit 45
- 66 Old Stow Rd
- 1687 Main St
- 16 Concord Greene Unit 5
- 27 Water St
- 100 Harrington Ave
- 37 Water St
- 29 Concord Greene Unit 3
- 1828 Main St
- 1844 Main St Unit 1844
- 65 Summit St
- 62 Edgewood Rd
- 245 Oak Hill Cir
Your Personal Tour Guide
Ask me questions while you tour the home.