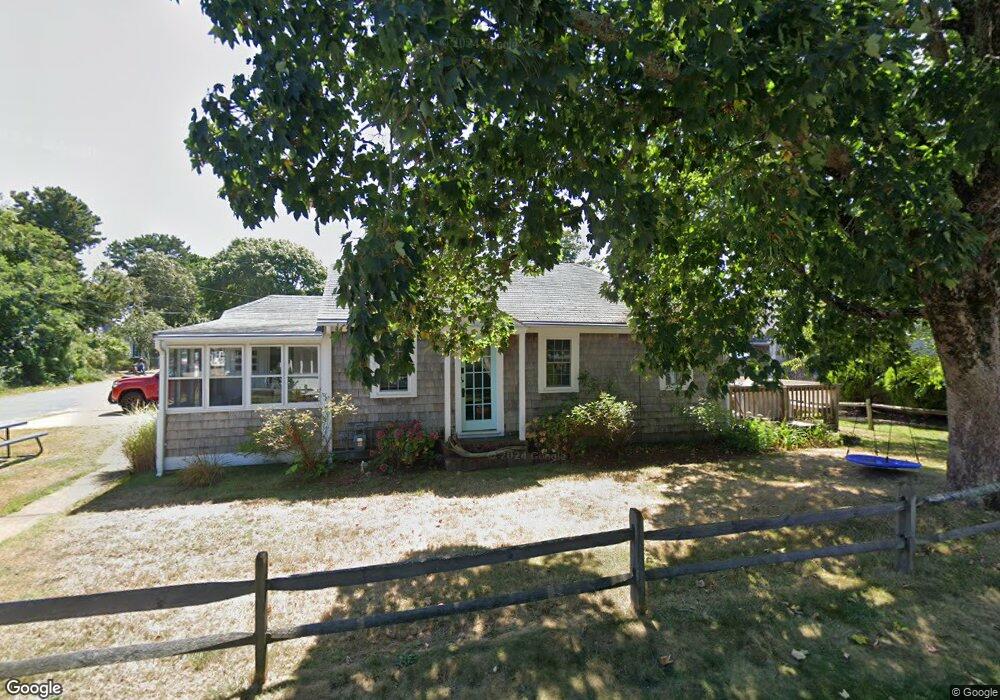
9 West St Dennis Port, MA 02639
Dennis Port NeighborhoodEstimated Value: $574,000 - $642,000
3
Beds
1
Bath
878
Sq Ft
$701/Sq Ft
Est. Value
About This Home
This home is located at 9 West St, Dennis Port, MA 02639 and is currently estimated at $615,400, approximately $700 per square foot. 9 West St is a home located in Barnstable County with nearby schools including Dennis-Yarmouth Regional High School and St. Pius X. School.
Ownership History
Date
Name
Owned For
Owner Type
Purchase Details
Closed on
May 23, 2017
Sold by
Lucey Janet M and Oneil Daniel
Bought by
Oneil Peter J and Oneil Paul G
Current Estimated Value
Purchase Details
Closed on
Mar 24, 2017
Sold by
Dean West Ret
Bought by
Lucey Janet M and Oneil Daniel
Create a Home Valuation Report for This Property
The Home Valuation Report is an in-depth analysis detailing your home's value as well as a comparison with similar homes in the area
Home Values in the Area
Average Home Value in this Area
Purchase History
| Date | Buyer | Sale Price | Title Company |
|---|---|---|---|
| Oneil Peter J | $134,856 | -- | |
| Lucey Janet M | -- | -- |
Source: Public Records
Tax History Compared to Growth
Tax History
| Year | Tax Paid | Tax Assessment Tax Assessment Total Assessment is a certain percentage of the fair market value that is determined by local assessors to be the total taxable value of land and additions on the property. | Land | Improvement |
|---|---|---|---|---|
| 2025 | $2,449 | $565,500 | $271,500 | $294,000 |
| 2024 | $2,285 | $520,500 | $261,100 | $259,400 |
| 2023 | $2,210 | $473,200 | $237,400 | $235,800 |
| 2022 | $2,000 | $357,100 | $187,100 | $170,000 |
| 2021 | $5,185 | $322,500 | $183,400 | $139,100 |
| 2020 | $5,325 | $309,600 | $183,400 | $126,200 |
| 2019 | $5,567 | $307,200 | $195,200 | $112,000 |
| 2018 | $1,824 | $287,700 | $185,900 | $101,800 |
| 2017 | $1,659 | $269,800 | $171,200 | $98,600 |
| 2016 | $1,590 | $243,500 | $161,400 | $82,100 |
| 2015 | $1,558 | $243,500 | $161,400 | $82,100 |
| 2014 | $1,484 | $233,700 | $151,600 | $82,100 |
Source: Public Records
Map
Nearby Homes
- 402 Old Wharf Rd
- 402 Old Wharf Rd
- 11 Ocean Park W
- 405 Old Wharf Rd Unit B204
- 405 Old Wharf Rd Unit B204
- 102 Sea St
- 9 Chase Ave Unit 6
- 26 Manning Rd
- 22 Ferncliff Rd
- 12 Cross St
- 159 Center St Unit 22
- 1 E Belmont Unit 630
- 37-A Beach Hills Rd
- 1 Belmont Rd Unit 630
- 1 Belmont Rd Unit 513
- 37 Beach Hills Rd
- 262 Old Wharf Rd Unit 67
- 262 Old Wharf Rd Unit 5
- 262 Old Wharf Rd Unit 5
- 262 Old Wharf Rd Unit 20